Dr. Bill Johnston’s scientific interests include agronomy, soil science, hydrology and climatology. With colleagues, he undertook daily weather observations from 1971 to 1979.
Abstract
Main points
Aerial
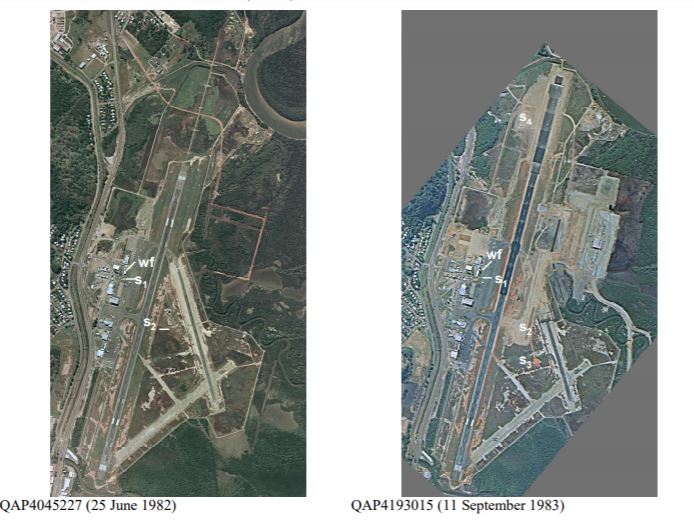
photographs and Royal Australian Air Force plans and documents held by the
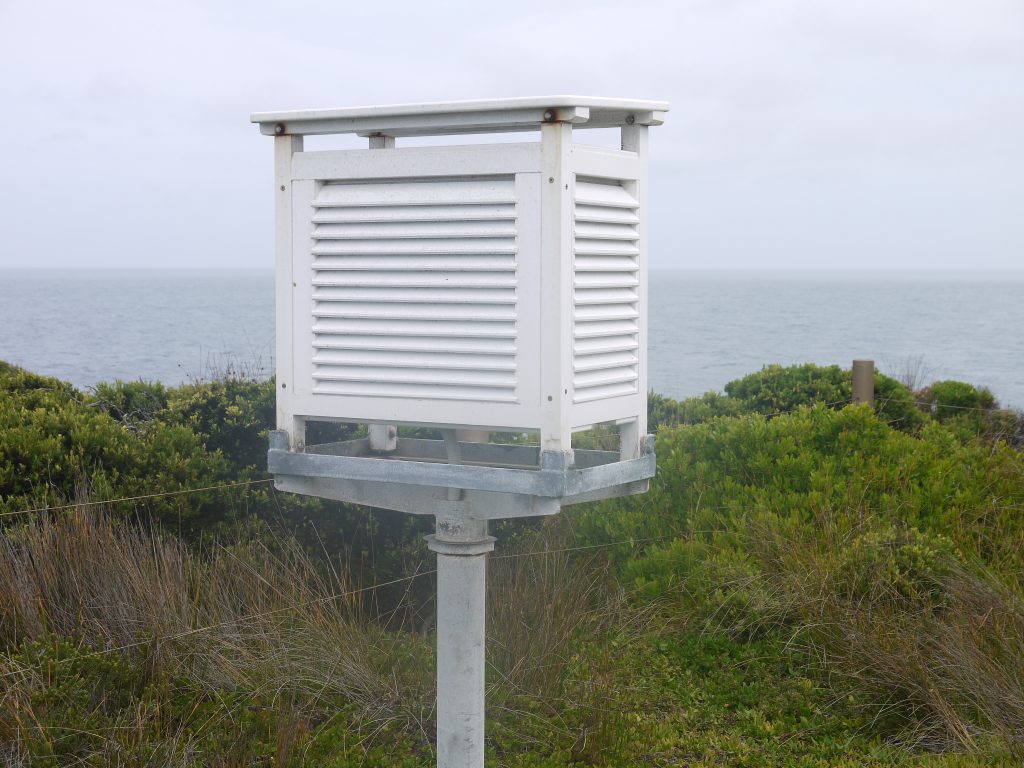
National Library and National Archives of Australia show the Stevenson screen
at Townsville airport moved at least three, possibly four times before 1969
while it was on the eastern side of the main runway; and probably twice between
when it moved to a mound on the western side in January 1970 and to the current
automatic weather station site in December 1994.
Of those site changes, a site move
in 1953/54 and another in 1970 resulted in step-changes in maximum temperature
data that were unrelated to the climate. A step-change in minima in 1968
appeared to be due to nearby disturbances associated with building an extension
to the met-office. Importantly, except in the Bureau’s Garbutt instruments
file, which is online at the National Archives (Barcode 12879364), none of the relocations or nearby
changes are listed or described in site-summary metadata.
By
ignoring prior changes and smoothing the 1994 transition to the automatic
weather station and small (60-litre) Stevenson screen, homogenisation created
trends in maximum and minimum temperature that had nothing to do with the
climate.
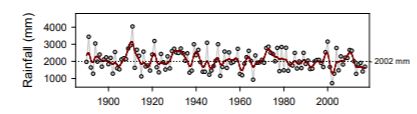
Accounting simultaneously for site-related
changes and covariates (rainfall for Tmax and Tmax for Tmin) leaves no residual
trend, change or cycles attributable to the climate. Thus there is no evidence
that the climate has warmed or changed.
Background
Like many of Australia’s ACORN-SAT weather stations[1],
the site at Townsville airport was set-up in 1939 as an Aeradio office for
monitoring air-traffic and to provide advice of inclement weather along the
east coast route between Melbourne and Port Moresby.
Changes in facilities, instruments and functions caused the
site to move irregularly; however, moves and changes prior to December 1994
were not detailed in ACORN-SAT or site-summary metadata. Despite repeated
assurances in peer-reviewed publications written by Bureau climate scientists
and others, that the history of ACORN-SAT sites had been exhaustively
researched and appropriate adjustments had been made for the effect of site
changes on data, it was not the case at Cairns and neither is it true for
Townsville.
As there is no measurable change or warming in temperature data for Townsville Airport, claims of catastrophic consequences for the Great Barrier Reef are unfounded in the temperature data and, as a consequence, are grossly overstated.
An important link – find out more
The page you have just read is the basic cover story for the full paper. If you are stimulated to find out more, please link through to the full paper – a scientific Report in downloadable pdf format. This Report contains far more detail including photographs, diagrams, graphs and data and will make compelling reading for those truly interested in the issue.
Note: Line numbers are provided in the linked Report for the convenience of fact checkers and others wishing to provide comment. If these comments are of a highly technical nature, relating to precise Bomwatch protocols and statistical procedures, it is requested that you email Dr Bill Johnston directly at scientist@bomwatch.com.au referring to the line number relevant to your comment.
Dr. Bill Johnston’s scientific interests include agronomy, soil science, hydrology and climatology. With colleagues, he undertook daily weather observations from 1971 to 1979.
Abstract
Main Points
The
weather station at Gladstone Radar marks the approximate southern extremity of
the Great Barrier Reef.
Temperature
and rainfall data are used to case study an objective method of analysing trend
and changes in temperature data.
The
3-stage approach combines covariance and step-change analysis to resolve site
change and covariable effects simultaneously and is widely applicable across
Australia’s climate-monitoring network.
Accounting for site and instrument changes
leaves no residual trend or change in Gladstone’s climate.
Background
In Part 1 of this series, temperature and rainfall data for
Gladstone Radar (Bureau of Meteorology (BoM) site 39326) are used to case-study
a covariate approach to analysing temperature data that does not rely on
comparisons with neighbouring sites whose data may be faulty.
Advantages of the method are:
The approach is based on physical principles and
is transparent, objective and reproducible across sites.
Temperature data are not analysed as time-series
in the first instance, which side steps the problem of confounding between
serial site changes and the signal of interest.
Changes in data that are unrelated to the causal
covariate are identified statistically and cross-referenced where possible to
independent sources such as aerial photographs and archived plans and
documents. Thus the process can’t be manipulated to achieve per-determined
trends.
The effect of site-changes and other
inhomogeneties are verified statistically in the covariate domain. Thus the
approach is objective and reproducible.
Covariate-adjusted data are tested for trend and
other systematic signals in the time-domain.
Further, statistical parameters such as significance of the overall fit (Preg), variation explained R2adj and significances of coefficients provide an independent overview of data quality.
An important link – find out more
The page you have just read is the basic cover story for the full paper. If you are stimulated to find out more, please link through to the full paper – a scientific Report in downloadable pdf format. This Report contains far more detail including photographs, diagrams, graphs and data and will make compelling reading for those truly interested in the issue.
Note: Line numbers are provided in the linked Report for the convenience of fact checkers and others wishing to provide comment. If these comments are of a highly technical nature, relating to precise Bomwatch protocols and statistical procedures, it is requested that you email Dr Bill Johnston directly at scientist@bomwatch.com.au referring to the line number relevant to your comment.
[1] Dr. Bill Johnston’s scientific interests include agronomy, soil science, hydrology and climatology. With colleagues, he undertook daily weather observations from 1971 to 1979.
Welcome to BomWatch.com.aua site dedicated to examining Australia’s Bureau of Meteorology, climate science and the climate of Australia. The site presents a straight-down-the-line understanding of climate (and sea level) data and objective and dispassionate analysis of claims and counter-claims about trend and change.
BomWatch delves deeply into the way in which data has been collected, the equipment that has been used, the standard of site maintenance and the effect of site changes and moves.
Dr. Bill Johnston is a former senior research
scientist with the NSW Department of Natural Resources (abolished in April
2007); which in previous guises included the Soil Conservation Service of NSW;
the NSW Water Conservation and Irrigation Commission; NSW Department of
Planning and Department of Lands. Like other NSW natural resource agencies that
conducted research as a core activity including NSW Agriculture and the National
Parks and Wildlife Service, research services were mostly disbanded or
dispersed to the university sector from about 2005.
BomWatch.com.au is dedicated to analysing climate statistics to the highest standard of statistical analysis
Daily weather observations undertaken by staff at the Soil Conservation Service’s six research centres at Wagga Wagga, Cowra, Wellington, Scone, Gunnedah and Inverell were reported to the Bureau of Meteorology. Bill’s main fields of interest have been agronomy, soil science, hydrology (catchment processes) and descriptive climatology and he has maintained a keen interest in the history of weather stations and climate data. Bill gained a Batchelor of Science in Agriculture from the University of New England in 1971, Master of Science from Macquarie University in 1985 and Doctor of Philosophy from the University of Western Sydney in 2002 and he is a member of the Australian Meteorological and Oceanographic Society (AMOS).
Bill receives
no grants or financial support or incentives from any source.
BomWatch accesses raw data from archives in Australia so that the most authentic original source-information can be used in our analysis.
How BomWatch operates
BomWatch is not
intended to be a blog per se, but rather a repository for analyses and
downloadable reports relating to specific datasets or issues, which will be
posted irregularly so they are available in the public domain and can be
referenced to the site. Issues of clarification, suggestions or additional
insights will be welcome.
The areas of
greatest concern are:
Questions about data quality and data
homogenisation (is data fit for purpose?)
Issues related to metadata (is metadata
accurate?)
Whether stories about datasets consistent and
justified (are previous claims and analyses replicable?)
Some basic principles
Much is said
about the so-called scientific method of acquiring knowledge by
experimentation, deduction and testing hypothesis using empirical data.
According to Wikipedia the scientific method involves careful observation,
rigorous scepticism about what is observed … formulating hypothesis …
testing and refinement etc. (see https://en.wikipedia.org/wiki/Scientific_method).
The problem
for climate scientists is that data were not collected at the outset for
measuring trends and changes, but rather to satisfy other needs and interests
of the time. For instance, temperature, rainfall and relative humidity were
initially observed to describe and classify local weather. The state of the
tide was important for avoiding in-port hazards and risks and for navigation –
ships would leave port on a falling tide for example. Surface air-pressure
forecasted wind strength and direction and warned of atmospheric disturbances;
while at airports, temperature and relative humidity critically affected
aircraft performance on takeoff and landing.
Commencing
in the early 1990s the ‘experiment’, which aimed to detect trends and changes
in the climate, has been bolted-on to datasets that may not be fit for purpose.
Further, many scientists have no first-hand experience of how data were
observed and other nuances that might affect their interpretation. Also since
about 2015, various data arrive every 10 or 30 minutes on spreadsheets, to
newsrooms and television feeds largely without human intervention – there is no
backup paper record and no way to certify those numbers accurately portray what
is going-on.
For historic
datasets, present-day climate scientists had no input into the design of the
experiment from which their data are drawn and in most cases information about
the state of the instruments and conditions that affected observations are
obscure.
Finally,
climate time-series represent a special class of data for which usual
statistical routines may not be valid. For instance, if data are not free of
effects such as site and instrument changes, naïvely determined trend might be
spuriously attributed to the climate when in fact it results from inadequate control
of the data-generating process: the site may have deteriorated for example or
‘trend’ may be due to construction of a road or building nearby. It is a
significant problem that site-change impacts are confounded with the variable
of interest (i.e. there are potentially two signals, one overlaid on the
other).
What is an investigation and what
constitutes proof?
The objective approach to investigating a
problem is to challenge the straw-horse argument that there is NO change, NO
link between variables, NO trend; everything is the same. In other words, test
the hypothesis that data consist of random numbers or as is the case in a court
of law, the person in the dock is unrelated to the crime. The task of an
investigator is to open-handedly test that case. Statistically called a
NULL hypothesis, the question is evaluated using probability theory,
essentially: what is the probability that the NULL hypothesis is true?
In law a person is innocent until proven guilty and
a jury holding a majority view of the available evidence decides ‘proof’.
However, as evidence may be incomplete, contaminated or contested the person is
not necessarily totally innocent –he or she is simply not guilty.
In a similar
vein, statistical proof is based on the probability that data don’t fit a
mathematical construct that would be the case if the NULL hypothesis were true.
As a rule-of-thumb if there is less than (<) a 5% probability (stated as P
< 0.05) that that a NULL hypothesis is supported, it is rejected in favour
of the alternative. Where the NULL is rejected the alternative is referred to
as significant. Thus in most cases ‘significant’ refers to a low P
level. For example, if the test for zero-slope finds P is less than
0.05, the NULL is rejected at that probability level, and trend is
‘significant’. In contrast if P >0.05, trend is not different to
zero-trend; inferring there is less than 1 in 20 chance that trend (which
measures the association between variables) is not due to chance.
Combined with an independent investigative approach BomWatch relies on statistical inference to draw conclusions about data. Thus the concepts briefly outlined above are an important part of the overall theme.
Using the air photo archives available in Australia, Dr Bill Johnston has carried out accurate and revealing information about how site changes have been made and how these have affected the integrity of the data record.