By David Mason-Jones,
Research by Dr. Lindsay Moore
The work of citizen scientist, Dr. Lindsay Moore, has failed to confirm an important IPCC prediction about what will happen to the spread between maximum and minimum temperatures due to the Enhanced Greenhouse Effect. The IPCC’s position is that this spread will narrow as a result of global warming.
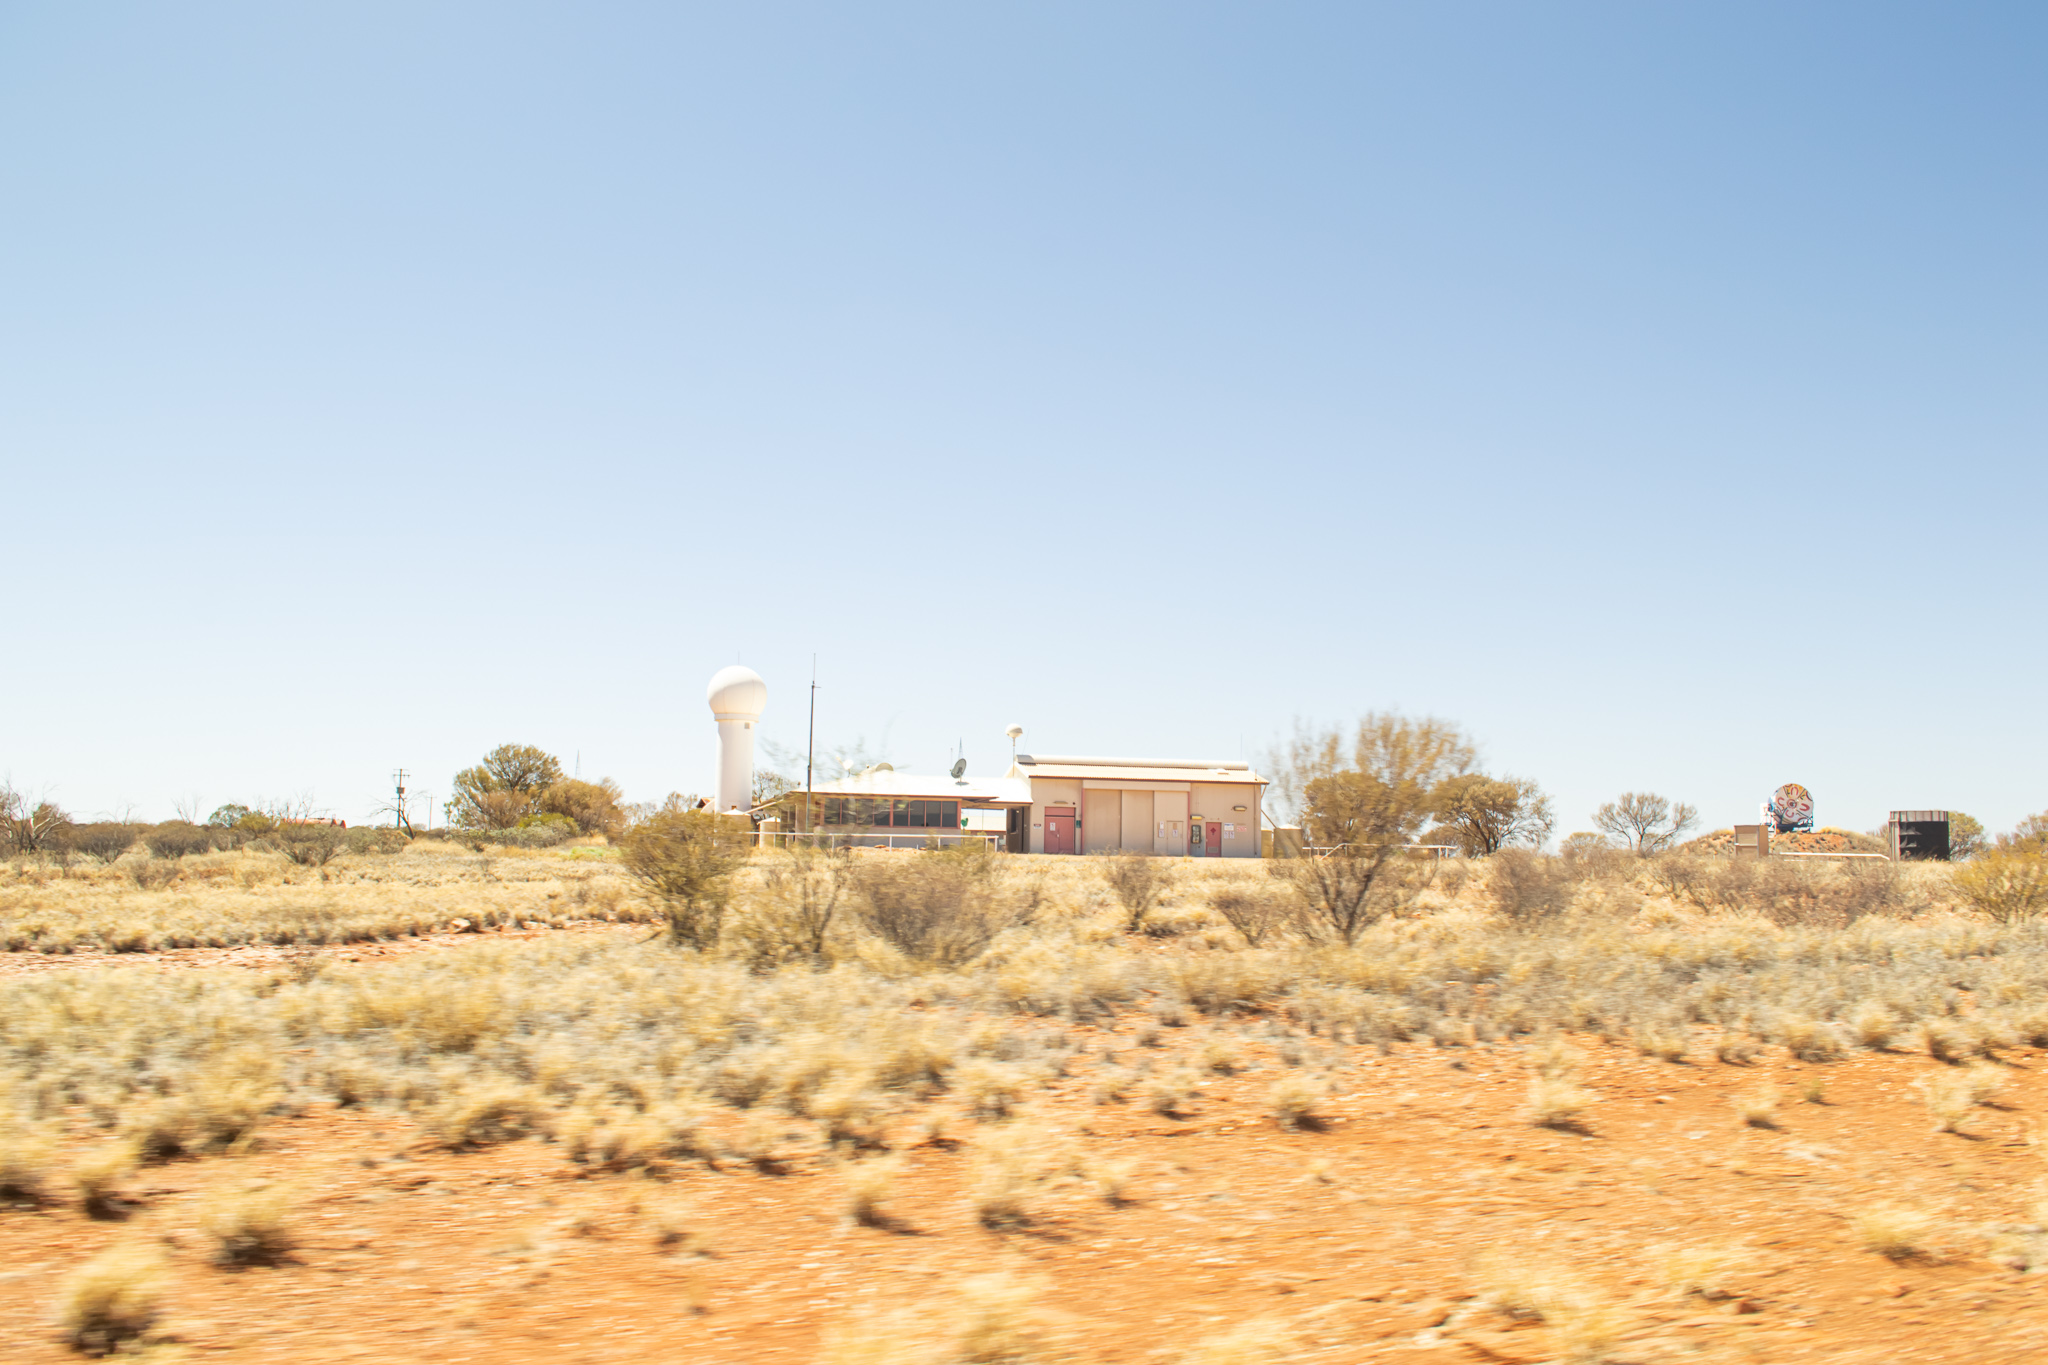
Moore’s work focuses on the remote weather station at Giles in Western Australia and run by Australia’s peak weather monitoring body, the Bureau of Meteorology (BoM).
Why Giles?
Giles is the most remote weather station in mainland Australia and its isolation in a desert makes it an ideal place to study the issue of temperature spread. It is virtually in the middle of the Continent.It is far from influencing factors such as Urban Heat Island effect, land use changes, encroachment by shading vegetation, shading by buildings and so on, that can potentially corrupt the data. Humidity is usually low and stable and it is far from the sea. In addition, as a sign of its importance in the BoM network, Giles is permanently staffed.
As stated, the IPCC hypothesis is that the ‘gap’ will become steadily smaller as the Enhanced Greenhouse Effect takes hold. As temperature rises the gap will narrow and this will result in an increase in average temperature, so says the IPCC.
Moore’s research indicates that this is just not happening at this showcase BoM site. It may be happening elsewhere, and this needs to be tested in each case against the range of all data-corrupting effects, but it is not happening at Giles.
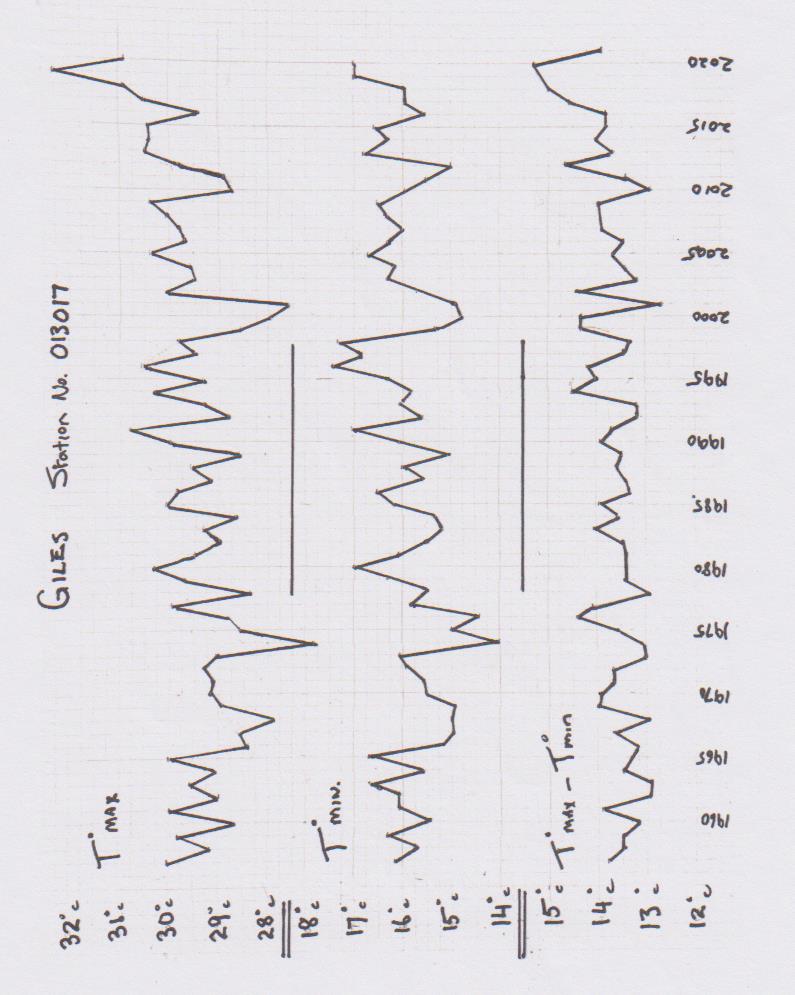
Notes about the graphs. The top plot line shows the average Tmax for each year – that is, the average maximum daytime temperature. The middle plot shows the average Tmin for each year – that is, the average minimum night time temperature.
The lower plot shows the result of the calculation Tmax-Tmin. In laypersons’ terms it is the result you get when you subtract the average yearly minimum temperature from the average yearly maximum temperature. If the IPCC hypothesis is valid, then the lower plot line should be falling steadily through the years because, according to the IPCC, more carbon dioxide in the atmosphere should make nights warmer. Hence, according to the IPCC’s hypothesis, the gap between Tmax and Tmin will become smaller – ie the gap will narrow. But the plot line does not show this.
The IPCC’s reasoning for its narrowing prediction is that global warming will be driven more by a general rise in minimum temps that it will be by a general rise in maximums. This is not my assertion, nor is it Dr. Moore’s, it is the assertion of the IPCC and can be found in the IPCC’s AR4 Report.
Dr. Moore states, “In the AR4 report the IPCC claims that elevated CO2 levels trap heat, specifically the long wave radiation escaping to space.
“As a result of this the IPCC states at page 750 that, ‘almost everywhere night time temperatures increase more than day time temperatures, that decrease in number of frost days are projected over time, and that temperatures over land will be approximately twice average Global temp rise,” he says citing page 749 of the AR4 report.
So where can we go to find evidence that the IPCC assertion of a narrowing spread of Tmax-Tmin is either happening or not happening? Giles is a great start point. Can we use the BoM’s own publicly available data to either confirm, or disprove, the narrowing prediction? The short answer is – Yes we can.
But, before we all get too excited about the result Dr. Moore has found, we need to recognise the limitation that this is just one site and, to the cautious scientific mind, may still be subject to some bizarre influence that somehow skews the result away from the IPCC prediction. If anyone can suggest what viable contenders for ‘bizarre influences’ might be at Giles we would welcome them in the comments section of this post.
The caution validly exercised by the rigorous scientific mind can be validly balanced by the fact that Giles is a premier, permanently staffed and credible site. The station was also set up with great care, and for very specific scientific purposes, in the days of the Cold War as part of the British nuclear test program in Australia in the 1950’s. It was also important in supplying timely and accurate meteorological data for rocket launches from the Woomera Rocket Range in South Australia in the development of the Bluestreak Rocket as part of the British/Australian space program. This range extended almost all the way across Australia from the launching site at Woomera to the arid North West of Western Australia.
In the early years there were several other weather monitoring stations along the track of the range. Such has been the care and precision of the operation of the station that Giles has the characteristics of a controlled experiment.
Dr. Moore states, “Giles is arguably the best site in the World because of its position and the accuracy and reliability of its records which is a constant recognised problem in many sites. Data is freely available on the BoM website for this site.”
With regard to the site validly having the nature of a controlled experiment, something about the method of analysis is also notable. The novel adoption of deriving the spread Tmax-Tmin by doing it on a daily basis neatly avoids meta data issues that have plagued the reliability of data from other stations and sometimes skewed results from other supposedly reliable observation sites.
“I would argue that the only change in environmental conditions over the life of this station is the increase in CO2 from 280 to 410 ppm,” he says.
“In effect this is, I suggest, a controlled experiment with the only identifiable variable input being CO2 concentration,” he says.
The conclusion reached by Dr. Moore is that an examination of the historical records for this site by accessing the same data through the BoM website unequivocally shows NO significant reduction in Tmax-Tmin. It also shows no rise in Tmin. Anyone can research this data on the Bureau of Meteorology website as it is not paywalled. It is truly sound data from a government authority for the unrestricted attention of citizens and other researchers.
Dr. Moore concludes, “The logical interpretation of this observation is that, notwithstanding any other unidentified temperature influencing factor, the Enhanced Greenhouse Effect due to elevated CO2 had no discernible effect on temperature spread at this site. And, by inference, any other site.”
He further states, “On the basis of the observations I have made, there can be no climate emergency due to rising CO2 levels, whatever the cause of the rise. To claim so is just scaremongering.
“Any serious climate scientist must surely be aware of such basic facts yet, despite following the science for many years, I have never seen any discussion on this specific approach,” he says.
Finally, Dr. Moore poses a few questions and makes some pertinent points:
He asks, “Can anyone explain, given the current state of the science why there is no rise in minimum temperatures (raw) or, more importantly, no reduction in Tmax-Tmin spread, over the last 65 years of records despite a significant rise in CO2 levels at Giles (280-410ppm) as projected by the IPCC in their AR4 report?” He notes that other published research indicates similar temperature profiles in the whole of the central Australian region as well as similarly qualified North American and World sites.
Seeking further input, he asks, “Can anyone provide specific data that demonstrates that elevated CO2 levels actually do increase Tmin as predicted by the IPCC?” And further, “Has there been a reduction in frost days in pristine sites as predicted by the IPCC?”
On a search for more information, he queries, “Can anyone explain why the CSIRO ‘State of the Climate’ statement (2020) says that Australian average temperatures have risen by more than 1 deg C since 1950 when, clearly, there has been no such rise at this pristine site?” With regard to this question, he notes that Giles should surely be the ‘go to’ reference site in the Australian Continent.
Again he tries to untangle the web of conflicting assertions by reputedly credible scientific organisations. He notes that, according to the IPCC rising average temperatures are attributable to rise in minimum temperatures. For the CSIRO State of the Climate statement to be consistent with this, it would necessitate a rise of around 2 deg C in Tmin. But, at Giles, there was zero rise. He also notes that, according to the IPCC, temperature rises over land should be double World average temperature rises. But he can see no data to support this.
Dr. Moore’s final conclusion: “Through examination of over 65 years of data at Giles it can be demonstrated that, in the absence of any other identifiable temperature forcing, the influence of the Enhanced Greenhouse Effect at this site appears to be zero,” he says. “Not even a little bit!”
David Mason-Jones is a freelance journalist of many years’ experience. He publishes the website www.bomwatch.com.au
Dr. Lindsay Moore, BVSC. For approaching 50 years Lindsay Moore has operated a successful veterinary business in a rural setting in the Australian State of Victoria. His veterinary expertise is in the field of large animals and he is involved with sophisticated techniques such as embryo transfer. Over the years he has seen several major instances in veterinary science where something that was once accepted on apparently reasonable grounds, and adopted in the industry, has later been proven to be incorrect. He is aware that this phenomenon is not only confined to the field of Veterinary Science but is happens in other scientific fields as well. The lesson he has taken from this is that science needs to advance with caution and that knee-jerk assumptions about ‘the science is settled’ can lead to significant mistakes. Having become aware of this problem in science he has become concerned about how science is conducted and how it is used. He has been interested in the global warming issue for around 20 years.
General link to Bureau of Meteorology website is www.bom.gov.au