Category Archives: Bureau of Meteorology

The 3-Degree Folly: the Australian Academy of Science Must Dump Its Support for Net Zero

Dr Bill Johnston

Instrument shelter (Stevenson screen) at Sydney Observatory December 2017. Site, instrument and screen size changes caused temperature to increase independently of the climate. (Photo credit Bill Johnston.)   

  • The Australian Academy of Science (AAS) has abandoned empirical scientific rigor in favour of advocacy, particularly in relation to climate change and net zero.
  • The risks to Australia of a 3°C warmer world (AAS-2021) is a politicised document recycled by activists within its ranks.
  • Historical climate variability is ignored in favour of a post-1950s “narrative” that data shows does not exist.
  • The policy and bureaucratic machinery surrounding climate legislation is highly centralised, economically destructive and not accountable to the electorate.

Net Zero is scientifically unjustified, economically irrational, democratically illegitimate and should be abandoned. The AAS should lead the way by dumping its support for net-zero.

Important links:

The rebuttal report is available here: (click here)

Commentary relating to the Report is available here: (Quadrant: the Australian academy of nonsense)

Royal Commission into National Natural Disaster Arrangements

Dr Bill Johnston

Crowdy Bay National Park January 2020 (Credit: Bill Johnston)

Summary and recommendations

  • Bushfire fighting capabilities are a matter for the States and the role of the Commonwealth should be limited to providing manpower (ADF personnel, who are largely untrained for firefighting per se.) and financial support on request. The problem with the Commonwealth assuming some overarching role is that it adds another level of complexity to an already over-crowded coordination-space; and as occurred during the recent crisis it also invites political grandstanding.
  • The proposal that the Commonwealth be able of its own volition to declare a state of national emergency is unsound. It could declare a ‘climate emergency’ for political purposes for example, when no such thing exists.
  • It ought to be of concern to the Commission that there is no evidence that Australia’s climate is changing or that summers are becoming longer, hotter or drier. Relationships between climate and bushfire are well understood and empirically predictable. Briefly, runs of years of above-average rainfall encourage fuel build-up, which if not controlled results in potentially cataclysmic fires once dry conditions return. As rainfall is episodic, unpredictable and shows no trend the contention that bushfire is related to some unnatural phenomenon is unsupportable and should not cloud the Commission’s deliberations.
  • It is a matter of great urgency to resolve the contradiction that, on the one-hand NSW Rural Fires Act (1997) compels managers of public and private land to undertake hazard reduction; while on the other, onerous environmental considerations make the carrying-out of hazard reduction more difficult and possibly illegal. As neither objective sits comfortably with the other, legislative change is recommended.
  • The intensity and unmanageability of recent fires in NSW resulted from the failure to mitigate biomass accumulation since the end of the Millennium drought in 2010/11. Blame for that situation lies squarely with the environmental provisions of the Rural Fires Act (1997), which places undue restraint on Rural Fire Service volunteers and others by requiring them to take account of ‘principles of sustainable development’ in order to gain approval for implementing control measures on public land.

Important link:

Click here for the detailed report (Click here)

Part 7d. Mount Isa, Queensland, Australia

Dr Bill Johnston

www.bomwatch.com.au

Mount Isa post office (Bureau of Meteorology, BoM ID 29125), and Mount Isa airport (Aero, 29127; Latitude -20.72o, Longitude 139.49) joined 1 January 1967; temperature data from 1 January 1957 to 31 December 2024; and separately, Mount Isa Mine (29126), Latitude – 0.7361, Longitude 139.4817; temperature from January 1965 to July 1992.

Although mining is due to cease in the near future, Mount Isa in central Queensland is home to one of the most productive single mines in the world. A post office opened in 1924, and the railway to the port of Townsville opened in 1929. An aerodrome constructed for the United States Army Air Force in 1943 became a major military camp during WWII. Post office data from 1957 were merged with Aero site data from January 1967.

While little seems known about conditions in the post office yard, site summary metadata suggests the Aero site was partially automated in September 1996, but a humidity probe was apparently not installed until March 2009. An Almos automatic weather station (AWS) has replaced manual observations but the changeover date is not available. Metadata also ignores when 60-litre Stevenson screens replaced 230-lite screens at the previous or current site; however, it is likely to have been before data for the earlier manual comparison site was so-designated. As metadata cannot be trusted, analysis is best undertaken using objective statistical methods.

While not an Australian Climate Observations Reference Network – Surface Air Temperature (ACORN-SAT) dataset used to monitor Australia’s warming, together with up to nine other sites including some ACORN-SAT ones, maximum temperature (Tmax) observed at the post office, airport and the mine were used by scientists at the BoM to homogenise ACORN-SAT sites as far afield as Victoria River Downs (1015 km), Rabbit Flat (987 km) and Longreach (571 km) (Figure 1).

Figure 1. In addition to Victoria River Downs, Rabbit Flat and Longreach, maximum temperature data for Mount Isa post office, Aero and the mine were used to homogenise ACORN-SAT sites at Tennant Creek, Camooweal, Burketown, Normanton and Richmond.   

As no attempt is made by ACORN-SAT to assess the quality of data used to construct comparator datasets, as a subset of Victoria River Downs, this study aimed to determine whether the combined Tmax dataset for the post office, airport (Aero), and the mine were fit for the purpose of homogenising other sites.

Conclusions

While Tmax data for the airport and mine were thermodynamically sound, due step-changes in their rainfall-adjusted mean, neither dataset was homogeneous. Lack of reliable metadata and corroborating information such as aerial photographs, satellite images and archived plans and documents, is a major problem in relating step-changes in data to changes at sites.

Possible site changes include undocumented site moves, removal of vegetation in the vicinity of screens using herbicide or mechanically, replacement of 230-litre Stevenson screens with 60-litre ones, introduction of the Almos AWS at the airport and the withdrawal of staff that maintained sites and instruments.

Checks and balances that are part of the BomWatch approach provide assurance that step-changes in 1966, 1980, 1996 and 2013 in the combined post office/Aero dataset, and in 1980 at the mine, are unrelated to the climate. Post hoc tests verified that data consist of non-trending segments delineated by step-changes that are unrelated to the weather.

Importantly, accounting for step-changes and rainfall simultaneously left no residual trend or change that could be attributed to CO2, coal mining, electricity generation or anything else.

The use of correlated, faulty data that are not homogeneous, to adjust faults in ACORN-SAT has no statistical or scientific merit and should be abandoned.

Important Links:

Click here to download the full paper with photos, graphs and data

Click Here to Download the Mount Isa DataPack

1871 Barrier Reef Sea Surface Temperature comparing then and now

Reassessing Climate Claims on the Great Barrier Reef

This paper critically reassesses claims that the Great Barrier Reef (GBR) is experiencing unprecedented warming and ecological decline due to climate change. Drawing on direct observational data, recent peer-reviewed literature, and physical principles of heat exchange, it challenges prevailing narratives of catastrophic warming, instead proposing a more constrained and evidence-based interpretation of reef temperature trends.

At the heart of the argument is a careful analysis of sea surface temperatures (SST) observed along the GBR by The Australian Institute of Marine Science. Contrary to widely circulated models suggesting sharp and continuous warming, the study finds that temperature increases over recent decades are modest, episodic, and largely bounded within historical variability. The paper draws attention to a critical statistical issue: many reports selectively use data that begins in the 1980s or later, omitting the earlier mid-20th-century cooling period. By using the full record from the 1870s onward, this study shows that current SST levels are not exceptional by historical standards.

A central theme is the physical constraint of evaporation, particularly the role of latent heat flux in regulating sea surface temperature. Drawing from classic thermodynamic theory and modern atmospheric science, the paper argues that ocean temperatures are inherently self-limiting due to the strong negative feedback of evaporative cooling. When SSTs rise, evaporation increases sharply, effectively capping further heating. This mechanism — while long recognized in meteorology — is often overlooked in policy reports and climate impact projections.

Several coral bleaching events are examined in light of this physical limit. The author notes that mass bleaching is not uniformly correlated with the highest recorded temperatures, nor does it follow a simple linear relation with SST anomalies. Instead, complex interactions between cloud cover, water clarity, depth, and preceding weather conditions often play a more decisive role. In some instances, reported bleaching occurred during relatively mild thermal stress, calling into question the attribution of such events solely to anthropogenic warming.

The paper is careful not to dismiss the reality of reef stress or the importance of stewardship. Rather, it argues that climate change is only one of several stressors, and possibly not the dominant one. Overfishing, poor water quality from runoff, and physical damage from cyclones remain significant threats. By focusing narrowly on temperature trends — and overstating their novelty — public discourse risks obscuring more tractable management issues.

From a policy standpoint, the paper urges a rebalancing of narratives: from alarmism rooted in model projections, to stewardship grounded in empirical observation. It makes a strong case that effective reef conservation must be rooted in realism, not rhetoric. Resources would be better spent on improving water quality, enforcing sustainable fishing practices, and supporting local scientific monitoring rather than pursuing large-scale climate interventions whose effects are slow and diffuse.

In sum, this manuscript provides a robust counterweight to dominant climate-fragility discourses surrounding the Great Barrier Reef. It brings data, physics, and field observation back to the centre of the discussion. While acknowledging that climate change is a relevant variable, the paper resists its inflation into a catch-all explanation for complex ecological dynamics. Its call for intellectual humility and empirical grounding is timely and welcome.

Find out more – follow this important link

Click here to access the full report including data, graphs and analysis

Is homogenisation of Australian temperature record any good?

Part 9. Rabbit Flat roadhouse, Northern Territory, Australia

Dr Bill Johnston

Former NSW Department of Natural Resources research scientist and weather observer.

scientist@bomwatch.com.au

Situated east of the Great Sandy-Tanami Desert, 450 km along the Tanami Track south from Halls Creek in Western Australia and 597 km north of Alice Springs, the Rabbit Flat roadhouse is one of the most isolated of the 112 Australian Climate Observations Reference Network – Surface Air Temperature (ACORN-SAT) sites used to monitor Australia’s climate. The site was selected by the Bureau of Meteorology (BoM) as a weather reporting station in December 1969 and useful data commenced in 1970.

The Rabbit Flat roadhouse beside the Tanami Track, is the site of a fresh-water bore east of the Tanami Desert. Maximum temperature (Tmax) is used to homogenise ACORN-SAT sites at Halls Creek, Victoria River Downs and Tennant Creek (solid lines). Dashed lines indicate stations used to homogenise Tmax at Rabbit Flat.

According to the ACORN-SAT catalogue, there was “no indication of any moves between 1969 and 1998”. As the roadhouse weather station site (BoM ID 15548) had become overgrown, an automatic weather station (AWS) was established about 200 m west on 13 November 1996 (BoM ID 15666). Daily maximum temperature (Tmax) for both sites was merged as per ACORN-SAT, summarised as annual averages, aligned with annual rainfall and analysed using BomWatch protocols.

Step-changes indicative of site changes, were detected in the merged dataset in 1986 and 2016, but not in 1997 after datasets were merged.

The magnitude of the change in 1986 (+0.87oC (±0.17sem)) is consistent with the Stevenson screen having moved from the vicinity of the roadhouse, where surrounds were possibly watered, to a more open position where conditions were generally warmer. Google Earth Pro satellite images show the up-step in 2016 (+0.89oC (±0.23sem)) resulted from erecting a 2.4m-high, chain-wire security fence, probably in 2015. Neither change could be attributed to the climate.

While adjustments for site changes are justified and necessary, it is vital that changepoints be detected objectively, and that adjustments directly match the magnitude of the effect.

ACORN-SAT V1 (to 2017) and V2.5 (to 2023) detected a significant changepoint in 1987, and another in 1997 corresponding with the merge. However, AcV2.5 failed to detect the significant changepoint in 2016. Adjustments made by AcV1 and AcV2.5 in 1987 were not the same, and in both cases were disproportionate to the rainfall-adjusted magnitude of the effect. Adjustments made by ACORN-SAT for merging the data in 1997, were also not the same.

The failure of AcV2.5 to adjust for installation of the security fence, which, as they paid for it, they must have known about, compounds previous errors, thus creating non-significant trends in homogenised data of 0.18oC/decade and 0.14oC/decade respectively.

A Google Earth Pro satellite image of the Rabbit Flat AWS on 18 August 2023. The Stevenson screen in the upper-right of the enclosure appears to be less than 4m from the 2.4m-high security fence. Fencing the site in 2015, groundcover destruction using herbicide, and other disturbances have warmed the site independently of the climate.    

Homogenisation adjustments by AcV1 and AcV2.5 in 1987 were not the same as the magnitude of the change they aimed to correct. Also, data were adjusted for a changepoint in 1997 that was not statistically significant. In addition, the significant site change in 2015 the BoM must have known about was ignored as though the effect on data reflected the climate.

The Bureau’s homogenisation methods cannot be independently replicated and it seems doubtful that statistical tests of differences with highly correlated neighbours are sufficiently sensitive to discriminate between step-change effects that are real and verifiable, and site and instrument changes that have no effect.  

ACORN-SAT also undertakes no post hoc tests to verify outcomes and check assumptions underlying the trend verses step-change model. ACORN-SAT adjustments resulted in non-significant positive trends of 0.18oC/decade for AcV1, and 0.14oC/decade for AcV2.5. In contrast, BomWatch protocols, which include verification and assumption tests, found that adjusting for step-changes and rainfall simultaneously left no residual trend that could be attributed to CO2, coalmining, electricity generation or anything else.     

Implications

The Bureau’s incessant marketing of fake record temperatures, record-hot years, heatwaves and in particular, runs of warm days, ignores that since 1970, Tmax at Rabbit Flat increased 1.76oC (±0.23sem) due to site changes alone. However, ignoring that the site had warmed independently of the climate, it was reported in March 2019 that Rabbit Flat smashed the national heat-record previously held by Marble Bar.

It was claimed that maximum temperature of 38.4oC on Tuesday 26 March 2019 ended the longest-run of 115-days of maximum temperatures over 39oC in Australia’s history. However, the Rabbit Flat site was not operating when the record of 106-days was set at Marble bar between November 1921 and March 1922.

ACORN-SAT has exceeded its use-by date. Site-summary and ACORN-SAT metadata has been poorly researched. Statistical tests of differences between comparator datasets that are not homogeneous, and faulty ACORN-SAT-site data, can find changepoints that make no difference, while not detecting those that do. As the methodology is fundamentally flawed, not scientific and cannot be replicated independently, the project should be abandoned in its entirety.   

Reference:

Trewin B.C., 2001. Extreme temperature events in Australia. PhD thesis, School of Earth Sciences, University of Melbourne.

NSW Bushfires 2019-2020

Submission by Dr. W.H. (Bill) Johnston

Terms of Reference for the inquiry were: (https://www.nsw.gov.au/nsw-government/projects-and-initiatives/make-submission-to-bushfire-inquiry/nsw-independent)

The Inquiry is to consider, and report to the Premier on, the following matters.

  1. The causes of, and factors contributing to, the frequency, intensity, timing and location of, bushfires in NSW in the 2019-20 bushfire season, including consideration of any role of weather, drought, climate change, fuel loads and human activity.
  2. The preparation and planning by agencies, government, other entities and the community for bushfires in NSW, including current laws, practices and strategies, and building standards and their application and effect.
  3. Responses to bushfires, particularly measures to control the spread of the fires and to protect life, property and the environment, including:
    • immediate management, including the issuing of public warnings
    • resourcing, coordination and deployment
    • equipment and communication systems.
  4. Any other matters that the inquiry deems appropriate in relation to bushfires.

Forty-four post-1910 daily rainfall datasets extending from Mallacoota (Vic.) to Yamba Pilot Station were summarised and examined; a select group of 10 from southeastern NSW and the Central Coast were analysed and from them, four or five were used to support the submission. 

A monthly water balance was used to identify long-term sequences of dry years. Drought sequences were also identified using stream discharge data for two unregulated streams in the Bega Valley. 

When efforts were made in 2013 to get hazard reduction action near our farm at Bemboka, contradictory sections of the NSW Rural Fires Act (1997) proved to be insurmountable. As the landscape continued to dry it was never a question of if but of when calamity would strike.

While the situation deteriorated and despite repeated warnings, the local Regional Advisory Committee and those in charge at Bushfire-HQ sat on their hands; paralysed by inaction. The Tathra fire in March 2018 was a wake-up call but no-body was awake. Local greenies blamed it on the climate, but it was failing electricity infrastructure. The rest is history … look over there; blame the Prime Minister …

From Gippsland to the North Coast of NSW and southern Queensland, irrespective of whether fires were deliberately lit or not, it can be fairly said the calamity of the so-called Black-summer bushfires resulted from a lack of appreciation of the emerging ‘big-picture’ threat; and of government policy and bureaucratic failures, not the climate.  

An important link – find out more

The page you have just read is the basic cover story for Dr. Johnston’s full paper. If you are stimulated to find out more, please link through to the full paper – a scientific Report in downloadable pdf format. This Report contains far more detail including photographs, diagrams, graphs and data and will make compelling reading for those truly interested in the issue.

Click here to download the full paper including photographs and tables of data used

About

Welcome to BomWatch.com.au a site dedicated to examining Australia’s Bureau of Meteorology, climate science and the climate of Australia. The site presents a straight-down-the-line understanding of climate (and sea level) data and objective and dispassionate analysis of claims and counter-claims about trend and change.
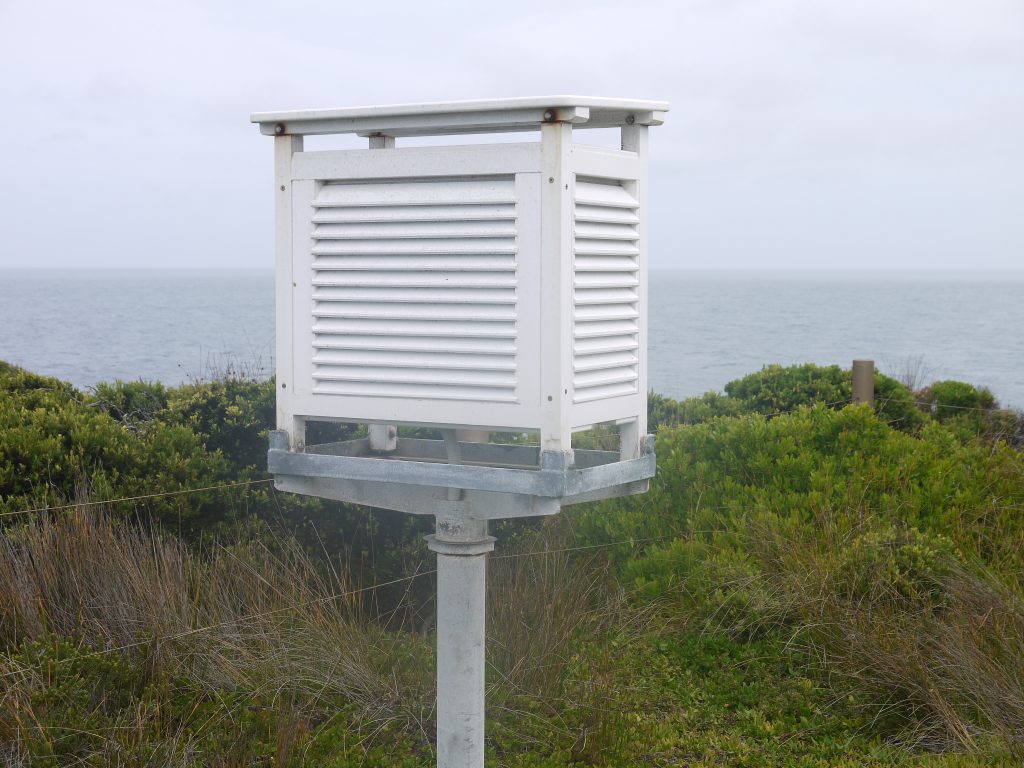
BomWatch delves deeply into the way in which data has been collected, the equipment that has been used, the standard of site maintenance and the effect of site changes and moves.

Dr. Bill Johnston is a former senior research scientist with the NSW Department of Natural Resources (abolished in April 2007); which in previous guises included the Soil Conservation Service of NSW; the NSW Water Conservation and Irrigation Commission; NSW Department of Planning and Department of Lands. Like other NSW natural resource agencies that conducted research as a core activity including NSW Agriculture and the National Parks and Wildlife Service, research services were mostly disbanded or dispersed to the university sector from about 2005.
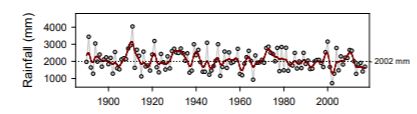
BomWatch.com.au is dedicated to analysing climate statistics to the highest standard of statistical analysis

Daily weather observations undertaken by staff at the Soil Conservation Service’s six research centres at Wagga Wagga, Cowra, Wellington, Scone, Gunnedah and Inverell were reported to the Bureau of Meteorology. Bill’s main fields of interest have been agronomy, soil science, hydrology (catchment processes) and descriptive climatology and he has maintained a keen interest in the history of weather stations and climate data. Bill gained a Batchelor of Science in Agriculture from the University of New England in 1971, Master of Science from Macquarie University in 1985 and Doctor of Philosophy from the University of Western Sydney in 2002 and he is a member of the Australian Meteorological and Oceanographic Society (AMOS).

Bill receives no grants or financial support or incentives from any source.
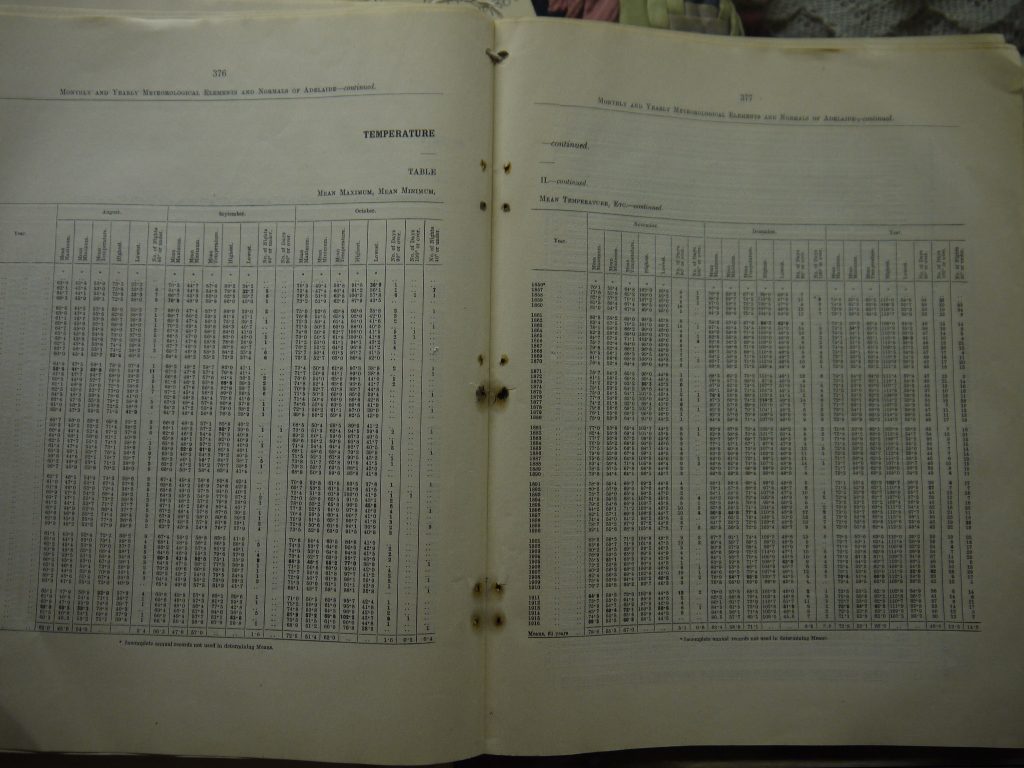
BomWatch accesses raw data from archives in Australia so that the most authentic original source-information can be used in our analysis.

How BomWatch operates

BomWatch is not intended to be a blog per se, but rather a repository for analyses and downloadable reports relating to specific datasets or issues, which will be posted irregularly so they are available in the public domain and can be referenced to the site. Issues of clarification, suggestions or additional insights will be welcome.   

The areas of greatest concern are:

  • Questions about data quality and data homogenisation (is data fit for purpose?)
  • Issues related to metadata (is metadata accurate?)
  • Whether stories about datasets consistent and justified (are previous claims and analyses replicable?)

Some basic principles

Much is said about the so-called scientific method of acquiring knowledge by experimentation, deduction and testing hypothesis using empirical data. According to Wikipedia the scientific method involves careful observation, rigorous scepticism about what is observed … formulating hypothesis … testing and refinement etc. (see https://en.wikipedia.org/wiki/Scientific_method).

The problem for climate scientists is that data were not collected at the outset for measuring trends and changes, but rather to satisfy other needs and interests of the time. For instance, temperature, rainfall and relative humidity were initially observed to describe and classify local weather. The state of the tide was important for avoiding in-port hazards and risks and for navigation – ships would leave port on a falling tide for example. Surface air-pressure forecasted wind strength and direction and warned of atmospheric disturbances; while at airports, temperature and relative humidity critically affected aircraft performance on takeoff and landing.

Commencing in the early 1990s the ‘experiment’, which aimed to detect trends and changes in the climate, has been bolted-on to datasets that may not be fit for purpose. Further, many scientists have no first-hand experience of how data were observed and other nuances that might affect their interpretation. Also since about 2015, various data arrive every 10 or 30 minutes on spreadsheets, to newsrooms and television feeds largely without human intervention – there is no backup paper record and no way to certify those numbers accurately portray what is going-on.

For historic datasets, present-day climate scientists had no input into the design of the experiment from which their data are drawn and in most cases information about the state of the instruments and conditions that affected observations are obscure.

Finally, climate time-series represent a special class of data for which usual statistical routines may not be valid. For instance, if data are not free of effects such as site and instrument changes, naïvely determined trend might be spuriously attributed to the climate when in fact it results from inadequate control of the data-generating process: the site may have deteriorated for example or ‘trend’ may be due to construction of a road or building nearby. It is a significant problem that site-change impacts are confounded with the variable of interest (i.e. there are potentially two signals, one overlaid on the other).

What is an investigation and what constitutes proof?

 The objective approach to investigating a problem is to challenge the straw-horse argument that there is NO change, NO link between variables, NO trend; everything is the same. In other words, test the hypothesis that data consist of random numbers or as is the case in a court of law, the person in the dock is unrelated to the crime. The task of an investigator is to open-handedly test that case. Statistically called a NULL hypothesis, the question is evaluated using probability theory, essentially: what is the probability that the NULL hypothesis is true?

In law a person is innocent until proven guilty and a jury holding a majority view of the available evidence decides ‘proof’. However, as evidence may be incomplete, contaminated or contested the person is not necessarily totally innocent –he or she is simply not guilty.

In a similar vein, statistical proof is based on the probability that data don’t fit a mathematical construct that would be the case if the NULL hypothesis were true. As a rule-of-thumb if there is less than (<) a 5% probability (stated as P < 0.05) that that a NULL hypothesis is supported, it is rejected in favour of the alternative. Where the NULL is rejected the alternative is referred to as significant. Thus in most cases ‘significant’ refers to a low P level. For example, if the test for zero-slope finds P is less than 0.05, the NULL is rejected at that probability level, and trend is ‘significant’. In contrast if P >0.05, trend is not different to zero-trend; inferring there is less than 1 in 20 chance that trend (which measures the association between variables) is not due to chance.

Combined with an independent investigative approach BomWatch relies on statistical inference to draw conclusions about data. Thus the concepts briefly outlined above are an important part of the overall theme. 
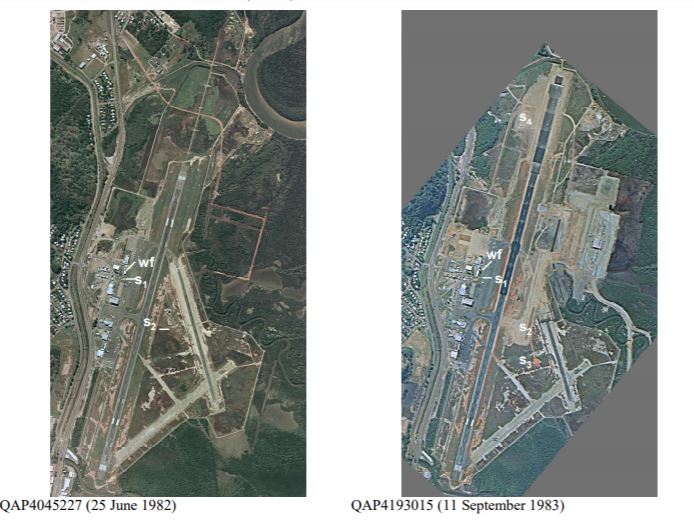
Using the air photo archives available in Australia, Dr Bill Johnston has carried out accurate and revealing information about how site changes have been made and how these have affected the integrity of the data record.