Tennant Creek NT [BoM ID 015135 (airport), 015087 (post office); joined 1 November 1970] Temperature data from February 1910 to December 2022.
Is homogenisation of Australian temperature data any good?
Dr Bill Johnston, former research scientist, NSW Department of Natural Resources
www.bomwatch.com.au
Protocols, which are essentially a description of the research question (hypothesis) and the means by which it would be addressed, lie at the heart of the scientific method. This report outlines the basis for, and steps involved in undertaking unbiased analysis of trend and change in Australian maximum temperature (Tmax) datasets using Tennant Creek as the case study.
Based on the First Law of Thermodynamics, BomWatch protocols are transparent, objective and replicable and provide a firm baseis for assessing trend and change in maximum temperature datasets and for resolving issues related to the Bureau of Meteorology’s homogenisation of the same data.
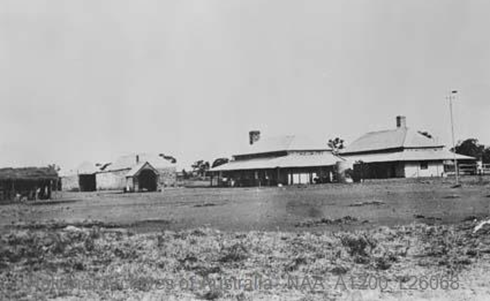
The Tennant Creek Telegraph station in 1872, showing a wind vane and Stevenson screen on the far right of the photograph (National Archives of Australia Item ID: 11774998). As the site was close to buildings, it was probably watered by bucket or watering-can during the seasonal ‘dry’.
Summary
The case study concluded that step-changes related to site changes caused Tmax to increase 1.51oC between 1910 and 2022 independently of rainfall, and that site-changes and rainfall simultaneously explained 73.8% of Tmax variation. Post hoc analysis found no residual trend or change was attributable to any other factor including CO2, coalmining, electricity generation or anything else.
Homogenisation cooled pre-1935 and pre-1963 Tmax to varying extents and achieved trends approaching 0.15oC/decade. Australian Climate Observations Reference Network – Surface Air Temperature V.2.4 also adjusted data higher from 1999 to 2015 by 0.52oC thereby smoothing the effect of post-2013 site changes so they appeared to be due to the climate. However, while trend became more significant and goodness-of-fit improved, variation in Tmax explained by rainfall declined from 46.3% initially, to 16.5% for ACORN-SATv.2.4.
Maps, plans, aerial photographs and satellite images show unequivocally that trend in Tmax data was mostly due to spraying out the grass and replacing the former 230-litre Stevenson screen in 2012, and installing a wind-profiler array within 45m of the screen before March 2013.
Bomwatch protocols
BomWatch protocols comprise four elements, namely:
· The overall relationship between Tmax and rainfall partitions total variation into that due to rainfall, and the residual non-rainfall part. Linear regression also derives the overall Tmax/rainfall coefficient, and significance (P) and goodness of fit (R2adj) statistics that indicate conformity with the First Law of Thermodynamics.
· Homogeneity analysis of rescaled residuals identifies non-climate impacts on data, which are categorised as step-change or (Sh)ift scenarios
· Segment-by-segment analysis with rainfall detects outliers, lack of fit, and other potential problems, and,
· Categorical multiple linear regression (and interaction analysis) finalises and verifies outcomes.
Segmented trend and graphical analysis confirm and verify that relationships are linear, residuals are normally distributed, independent, with constant variance, and that they are timewise homogeneous.
Based on the First Law Theorem that maximum temperature depends on rainfall, BomWatch protocols provide an unequivocable basis for understanding the effect of non-climate impacts on data, and for objectively assessing the BoM’s homogenisation methods.
Is homogenisation of Australian temperature data any good?
Is homogenisation of Australian temperature data any good?
Part 7b. Timber Creek, Northern Territory, Australia
Bureau of Meteorology ID 14850, Latitude -15.6614 Longitude 130.4808.
Dr Bill Johnston
scientist@bomwatch.com.au
Summary
Data quality is poor. The use of faulty data that are not homogeneous, to adjust faults in ACORN-SAT data is unscientific and likely to result in biased outcomes. As the ACORN-SAT project does not ensure comparator datasets are homogeneous, it is deeply flawed and should be abandoned. Read on …
The quality of Tmax data for Timber Creek is exceptionally poor. Its use for adjusting faults in ACORN-SAT data is highly questionable. Data are affected by missing daily data, poor site-control and the probable replacement of a 230-litre Stevenson screen with a 60-litre one around 1996. Although data lack precision, accounting for rainfall and the up-step in 1996 left no residual variation attributable to CO2, coalmining, electricity generation or anything else.
Background
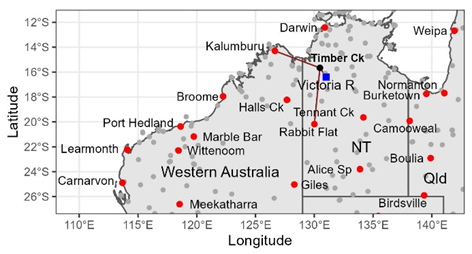
The isolated town of Timber Creek is located beside the Victoria River, on the Victoria Highway, 600km south of Darwin and 280m southwest of Katherine in the Northern Territory (Figure 1). The Victoria River flows west to the Joseph Bonaparte Gulf close to the Western Australia – Northern Territory border. Daily maximum temperature (Tmax) data is available from the Bureau of Meteorology (BoM) from 23 January 1961, to when the station closed on 5 September 2014.
Figure 1. Timber Creek and other weather stations having more than 10-years of records (grey points), and Victoria River Downs (blue) and other ACORN-SAT sites in northern Australia (red buttons).
Tmax data for Timber Creek was used to adjust ACORN-SAT sites at Victoria River Downs, Kalumburu, and Rabbit Flat (Table 1). So, is Tmax data for Timber Creek any good?
Table 1. ACORN-SAT sites adjusted at the dates indicated using Tmax data for Timber Creek.
ACORN-SAT site: (Distance to Timber Ck.)
Vic. River Downs (ID 14825) (106km)
Kalumburu (ID 1019) (434km)
Rabbit Flat (ID 15666) (509km)
Adjust dates AcV1 (2009)
1 Aug 1987
1 Jan 1986 23 Aug 1991
Nil
Adjust dates AcV2.1 (2020)
Nil
1 Jan 1986 23 Aug 1991
1 March 1997
Adjust Dates AcV2.3 (2023)
Nil
1 Jan 1986 23 Aug 1991
1 March 1997
Methods
Daily temperature and monthly rainfall were downloaded from the Bureau of Meteorology, Climate Data Online facility (Climate Data Online – Map search (bom.gov.au)). Monthly rainfall was infilled as necessary using data for the nearest available site and flagged for reference. Data were summarised into an annual dataset (Timber Creek.xlsx) and analysed using the same BomWatch protocols described previously in the Parafield case study1 and subsequent reports, including for Victoria River Downs2 of which this report is a subset.
Only maximum temperature (Tmax) data were analysed.
Results
Missing daily observations may have affected mean annual Tmax in 1987, 2008 and 2013 (N <346 observations/year); however, influence plots did not suggest those years were outliers. Outlier years which were identified (but also not omitted) were 1998, 2005 and 2013. Observations appeared to become lackadaisical after 2006. No other attributes of the data were remarkable.
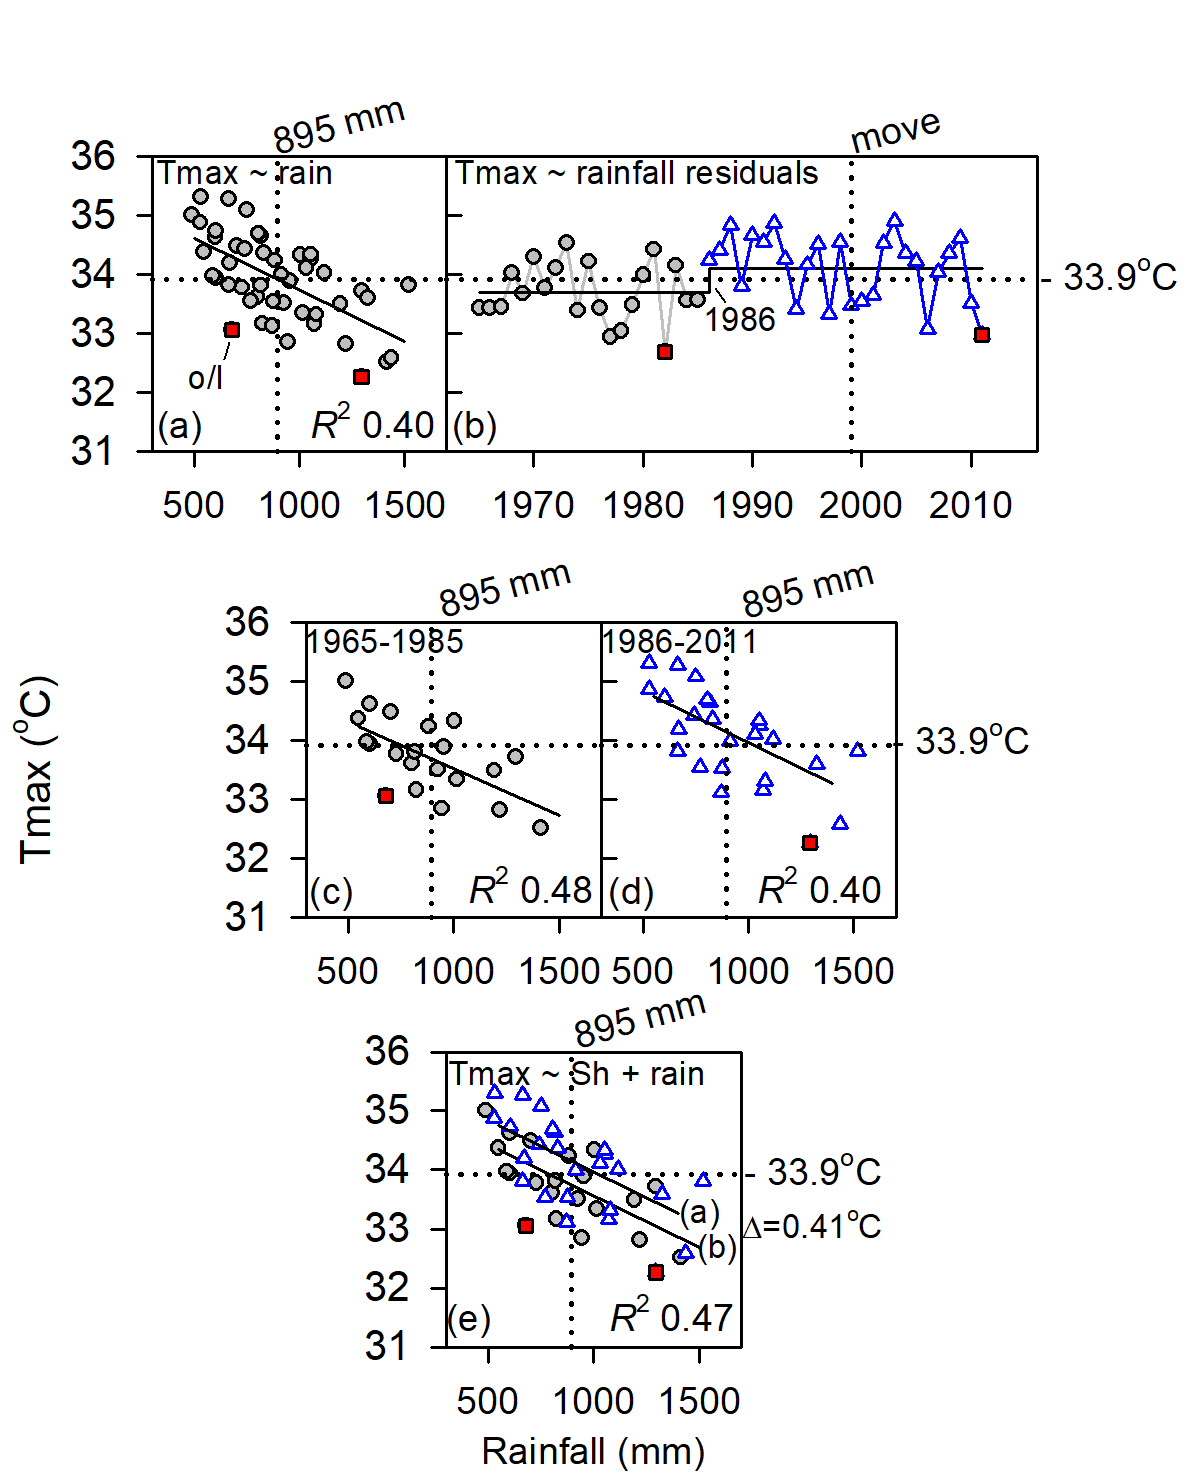
Rainfall, which is the deterministic portion of the Tmax signal explained 27.0% of Tmax variation (Figure 2(a)), which is low relative to the BomWatch benchmark of R2adj = 0.50. Either data quality is exceedingly poor, or an influential variable has not been accounted for by the naïve Tmax ~ rainfall case (Table 1(i)).
(Note: R2adj calculated by the statistical package R, adjusts variation explained for the number of terms in the linear model, as well as for the number of observations3. It is therefore more robust (less biased) than unadjusted R2 calculated by spreadsheet programs such as Excel.)
Figure 2. Composite analysis of Timber Creek Tmax.
Inhomogeneities in rescaled Tmax ~ rainfall residuals were evaluated using STARS, which objectively tests whether the mean of subsequent values is significantly different (P<0.05) to that before, using a running t-test of the difference.
Indicated by the horizontal line in Figure 2(b), STARS detected an up-step of 0.47oC in 1996 (P = 0.003). Segments defined by the step-change were examined separately in Figure 2(c) and Figure 2(d) and Table 1(ii).
Categorical multiple linear regression (Table 1(iii)) showed rainfall reduces Tmax 0.175oC/100mm, and that segmented regressions were offset by a rainfall-adjusted difference of 0.58oC (Figure 2(e)), which is within range of that detected by STARS.
Post hoc tests (Table 1(iv)), confirmed that data consisted of two non-trending segments interrupted by the step-change in 1996.
Although data lack precision (R2adj <0.50, Table 1(iii)), accounting for rainfall and the step change in 1996, left no residual variation attributable to CO2, coalmining, electricity generation or anything else.
Table 1. Statistical summary. RSS refers to residual sum of squares. Partial R-square (R2partial) estimates the proportion of variation explained by the Sh(ift)factor that is not explained by rainfall alone (calculated as: [(RSSfull – RSSrain)/ RSSfull)*100].
(1) Letters in parenthesis indicate differences between means (2) No outliers
Discussion
Relationships between Tmax and rainfall (Table 1) show shows the quality of Tmax data for Timber Creek is exceptionally poor, which raises the question why would it be used to adjust ACORN-SAT sites at Victoria River Downs, Kalumburu, and Rabbit Flat? Furthermore, the step-change in 1996 is likely due to the former 230-litre Stevenson screen being replaced by a 60-litre one during the previous year.
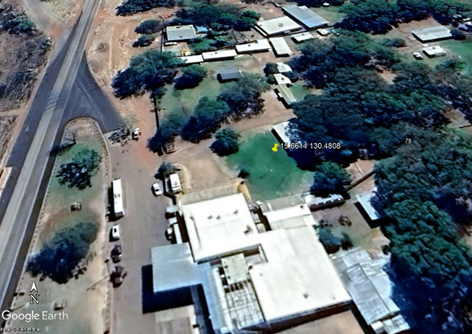
Despite problems with watering and missing observations, Victoria River Downs is one of only several closed or open sites within 200km with reasonable runs of Tmax data (Kununurra town and airport and Kimberley Research Station being others). Although Timber Creek closed in September 2014, it seems from available Google Earth Pro satellite images the site was watered (Figure 3).
Figure 3. The satellite image of the alleged Timber Creek weather station site in August 2022 at Latitude -15.6614o, Longitude 130.4808o. However, the site looks nothing like the site diagram shown in site-summary metadata. There is no sign of the ‘chook shed’, while the ‘house’, appears to be the Timber Creek Travellers Rest Motel and caravan park. Successive images also show the grass surrounding the site is regularly watered. Either the coordinates provided in metadata are incorrect or the diagram is inaccurate.
The problem is that site-summary metadata is faulty.
Close inspection of properties around the town, located the Stevenson screen inside a fenced area that matched the site diagram, at Latitude -15.6600o, Longitude 130.4819o, approximately 190m NE of the location shown in Figure 3.
While regular manual observations may have ceased, the most recent satellite image (August 2023) shows the Stevenson screen is still located within the enclosure. Images from August 2002, show land-use changes, possibly irrigation and the use of herbicide between seasons and years contributed variation that impacted observations, and therefore that lack of site control was the main factor affecting the quality of Tmax data.
Given the paucity of nearby sites, and the lack of useful long-term data, Timber Creek is not such a big overcrowded place that the BoM could not have installed an automatic weather station on vacant land somewhere in the town where site conditions were consistent with the local climate – high monsoonal rainfall from November to March (summer) and low rainfall during the ‘dry’. Unreliable metadata, including routinely failing to document when Stevenson screens are replaced, and lack of site control is a major problem across Australia’s weather station network.
Conclusion
It is concluded that the quality of Tmax data for Timber Creek is exceptionally poor and its use for adjusting faults in ACORN-SAT data at Victoria River Downs, Kalumburu and Rabbit Flat is highly questionable. Data are affected by missing daily data, poor site-control and the probable replacement of a 230-litre Stevenson screen with a 60-litre one around 1996. Although data lack precision, accounting for rainfall and the step change in 1996 left no residual variation attributable to CO2, coalmining, electricity generation or anything else.
Bill Johnston
18 February 2024
Preferred citation:
Johnston, Bill 2024. Is homogenisation of Australian temperature data any good? Part 7b. Timber Creek, Northern Territory, Australia http://www.bomwatch.com.au/ 4 pp.
Disclaimer
Unethical scientific practices including the homogenisation of data to support political narratives undermines trust in science. While the persons mentioned or critiqued may be upstanding citizens, which is not in question, the problem lies with their approach to data, use of poor data or their portrayal of data in their cited and referenceable publications as representing facts that are unsubstantiated, statistically questionable or not true. The debate is therefore a scientific one, not a personal one.
Acknowledgements
David Mason-Jones is gratefully acknowledged for providing invaluable editorial assistance. Research