Monthly Archives: January 2023

5. Potshot & ACORN-SAT

Is homogenisation of Australian temperature data any good?

Part 5. Potshot and ACORN-SAT

Dr Bill Johnston

Former NSW Department of Natural Resources research scientist and weather observer.

scientist@bomwatch.com.au

Careful analysis using BomWatch protocols showed that ACORN-SAT failed in their aim to “produce a dataset which is more homogeneous for extremes as well as for means”. Their failure to adjust the data for a step-change in 2002 shows unequivocally that methodology developed by Blair Trewin lacks rigour, is unscientific and should be abandoned.

Read on …

Potshot was a top-secret long-shot – a WWII collaboration between the United States Navy, the Royal Australian Air Force and Australian Army, that aimed to deter invasion along the lightly defended north-west coast of Western Australia and take the fight to the home islands of Japan. It was also the staging point for the 27- to 33-hour Double-Sunrise Catalina flying-boat service to Ceylon (now Sri Lanka) that was vital for maintaining contact with London during the dark years of WWII. It was also the base for Operation Jaywick, the daring commando raid on Singapore Harbour by Z-Force commandos in September 1943.

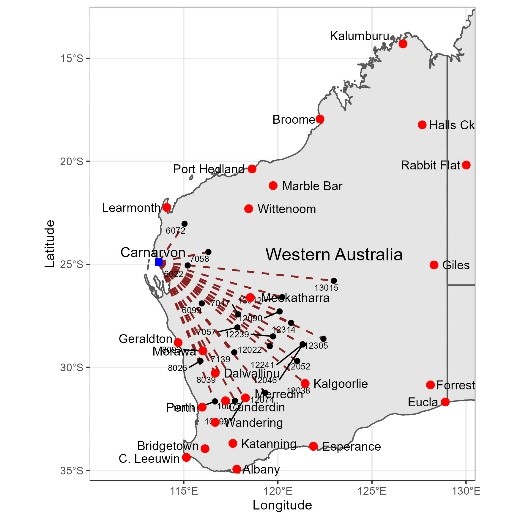
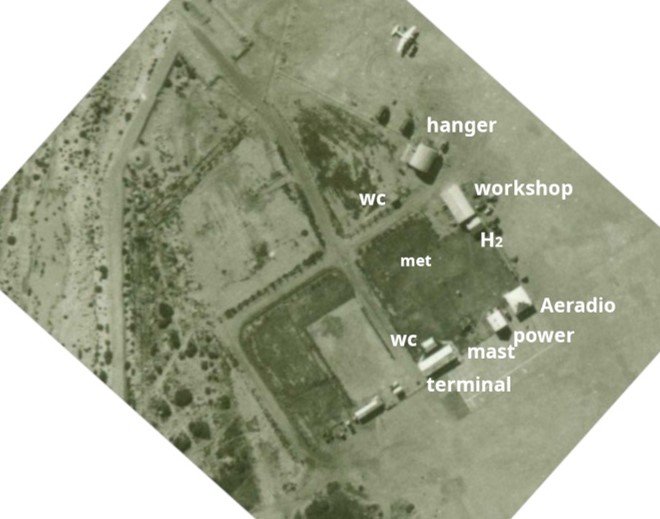
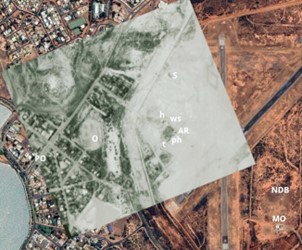
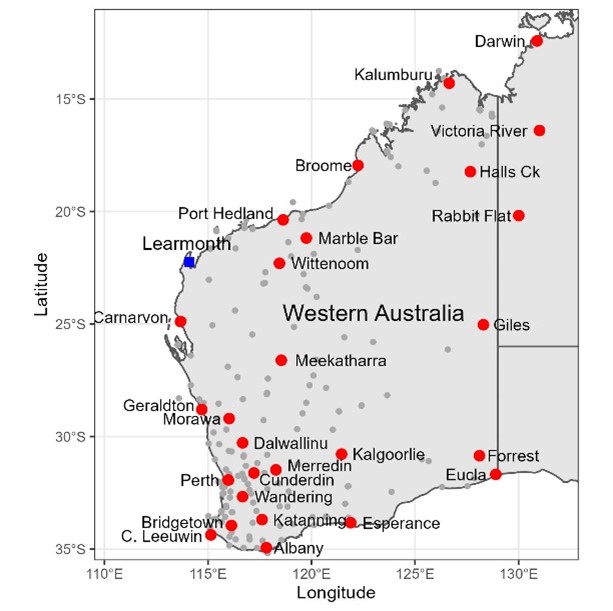
The key element of Potshot was the stationing of USS Pelias in the Exmouth Gulf to provide sustainment to US submarines operating in waters to the north and west. To provide protection, the RAAF established No. 76 OBU (Operational Base Unit) at Potshot in 1943/44 and, at the conclusion of hostilities, OBU Potshot was developed as RAAF Base Learmonth, a ‘bare-base’ that can be activated as needed on short-notice. Meteorological observations commenced at the met-office in 1975. Learmonth is one of the 112 ACORN-SAT sites (Australian Climate Observations Reference Network – Surface Air Temperature) used to monitor Australia’s warming. Importantly, it is one of only three sites in the ACORN-SAT network where data has not been homogenised.

Potshot was the top-secret WWII base that transitioned to RAAF Base Learmonth at the conclusion of WWII.  

  • By not adjusting for the highly significant maximum temperature (Tmax) step-change in 2002 detected by BomWatch, ACORN-SAT failed its primary objective which is to “produce a dataset which is more homogeneous for extremes as well as for means”.
  • Either Blair Trewin assumed the 12-year overlap would be sufficient to hide the effect of transitioning from the former 230-litre Stevenson screen to the current 60-litre one; or his statistical methods that relied on reference series were incapable of objectively detecting and adjusting changes in the data.
  • In either case it is another body-blow to Trewin’s homogenisation approach. Conflating the up-step in Tmax caused by the automatic weather station and 60-litre screen with “the climate” and lack of validation within the ACORN-SAT project generally, unethically undermines the science on which global warming depends.
    • Due to their much-reduced size, and lack of internal buffering, 60-litre Stevenson screens are especially sensitive to warm eddies that arise from surfaces, buildings etc. that are not representative of the airmass being monitored.
    • Increased numbers of daily observations/year ≥95th day-of-year dataset percentiles relative to those ≤5th day-of-year percentiles, which explains the up-step, is a measurement issue, not a climatological one.

By omission in the case of Learmonth, as ACORN-SAT produces trends and changes in homogenised data that do not reflect the climate, the project and its peers including others run under the guise of the World Meteorological Organisation of which Trewin is a major player, should be abandoned.   

Dr. Bill Johnston

12 January 2023     

Two important links – find out more

First Link: The page you have just read is the basic cover story for the full paper. If you are stimulated to find out more, please link through to the full paper – a scientific Report in downloadable pdf format. This Report contains far more detail including photographs, diagrams, graphs and data and will make compelling reading for those truly interested in the issue.

Click here to download the full paper with photos graphs and data.

Second Link: This link will take you to a downloadable Excel spreadsheet containing a vast number of supporting data points for the Carnarvon paper.

Click here to download the Excel spreadsheet

Postscript

Dr Trewin and his peers, including those who verify models using ACORN-SAT data, scientists at the University of NSW including Sarah Perkins-Kilpatrick, those who subscribe to The Conversation or The Climate Council are welcome to fact-check or debate the outcome of our research in the open by commenting at www.bomwatch.com.au. The Datapack relating to the Potshot Report is available here Learmonth_DataPack

4. Carnarvon, WA

Is homogenisation of Australian temperature data any good?

Part 4. Carnarvon, Western Australia

Dr Bill Johnston[1]

scientist@bomwatch.com.au

The ACORN-SAT project is deeply flawed, unscientific and should be abandoned.

Read on …

Maximum temperature data for Carnarvon, Western Australia is surprisingly no use at all for tracking climatic trend and change. With Learmonth close second at Longitude 114.0967o, Carnarvon (113.6700o) is the western-most of the 112 stations that comprise the ACORN-SAT network (Australian Climate Observations Reference Network – Surface Air Temperature) used to monitor Australia’s warming (Figure 1). Carnarvon is also just 1.4o Latitude south of the Tropic of Capricorn but unlike Learmonth, which receives moderate rain in February, Carnarvon receives practically none from the end of August through to March. Due to its vast underground aquifer, the lower Gascoyne is the most productive irrigation area in WA and most of the vegetables, melons and fruits sold in Perth are grown around Carnarvon.

Figure 1. The distribution of ACORN-SAT sites in WA, as well as all the neighbouring sites used by ACORN-SAT v.3 to homogenise Carnarvon data. 

Located about 900 km north of Perth, Carnarvon post office, built in 1882, was an important link in the expanding WA telegraph network and the aerodrome was an important refuelling stop. Runways were lengthened by the Royal Australian Air Force and during WWII it was used as a forward operation base

Servicing the main 1930s west-coast air corridor from Perth to Darwin, and Java and on to Europe, Aeradio was established by the Air Board in Geraldton, Carnarvon, Port Hedland, and at aerodromes every 300 km or so further north, and around Australia in 1939/40. A close-up view of Carnarvon Aeradio snipped from a 1947 aerial photograph is shown in Figure 2. While weather observers trained by the Bureau of Meteorology (BoM) in Melbourne undertook regular weather observations, prepared forecasts and provided pilot briefings, radio operators maintained contact with aircraft and advised of inclement conditions. As units were well-distributed across the continent, combined with post officers that reported weather observations by telegraph, the aeradio network formed the backbone of ACORN-SAT. Homogenisation of their data with that of post offices, lighthouses and pilot stations ultimately determines the apparent rate of warming in Australia’s climate.

Figure 2. A snip of the Carnarvon aerodrome operations precinct in 1949 showing location of facilities and that are area in the vicinity of the met-enclosure (met) was watered. (Three additional radio masts were located within in the watered area and watering was probably necessary to ensure grounding of the earth-mat buried in the dry soil.) 

Despite several rounds of peer review the question of whether trends and changes in raw data are homogenised Tmax data reflect site and changes or the true climate has not been independently assessed.

The research is important. Alteration of data under the guise of data homogenisation, flows through to BoM’s annual climate statements, CSIRO’s State of the Environment, and State of the Climate reports, reports put out by IPCC, COP, and the World Economic Forum, and ultimately government supported scare campaigns run by WWF, the Climate Council and other green groups, that underpin the unattainable goal of net-zero.

Commencing around 1990, Australia’s homogenisation campaign has been overseen by Dr Neville Nicholls, Emeritus Professor at Monash University, a loud and vocal supporter of the warming hypotheses. Changing the data on which it is based, then claiming in collegially peer-reviewed publications that the climate is warming, risks considerable economic, strategic and political harm. Australia is being weakened from within by Nicholls and his protégés, including those within CSIRO, and every aspect of the economy, from de-industrialisation, to attacks on agriculture, to looming conflict with China is predicated by temperature data homogenisation.

Summary findings

  • Good site control is fundamental to any experiment investigating long-term trend and change. However, the site at the post office was shaded, watered and generally poor, the Aeradio site was also watered, while the site at the meteorological office was subject to multiple changes after 1990.
  • Homogenisation failed to undertake basic quality assurance and frequency analysis, so could not objectively adjust for the effect of extraneous factors such as watering, site chances etc. Consequently, as ACORN-SAT data for Carnarvon were not homogeneous either for extremes or annual means it failed its primary objective.

While changing data to agree with hypotheses is unscientific and dishonest, the most obvious homogenisation subterfuge is the adjustment of changes that made no difference to the data, while ignoring those that did. Second, using reference series comprised of neighbouring datasets without ensuring they are homogeneous.

The use of correlated data that likely embed parallel faults to disproportionally correct faults in ACORN-SAT data and thereby embed trends in homogenised data, has no statistical or scientific merit. As the ACORN-SAT project is misleading irredeemably deeply flawed and is a clear danger to Australia’s prosperity and security, it should be abandoned.

A reoriented and rescaled overlay of an aerial photograph showing the watered airport precinct relative to the location of the post office in 1947, and the November 2021 Google Earth Pro satellite image, locating the same sites. Runways were unsealed in 1947 and there were still several splinter-proof aircraft shelters visible (marked ‘s’). By 2021 they had moved the non-directional beacon (NDB) from behind the power house (ph), and the site to the right of the meteorological office (MO) had been moved out of the way of the access road. The MO closed in 2016.

3 January 2023

Two important links – find out more

First Link: The page you have just read is the basic cover story for the full paper. If you are stimulated to find out more, please link through to the full paper – a scientific Report in downloadable pdf format. This Report contains far more detail including photographs, diagrams, graphs and data and will make compelling reading for those truly interested in the issue.

Click here to download the full paper with photos graphs and data

Second Link: This link will take you to a downloadable Excel spreadsheet containing a vast number of supporting data points for the Carnarvon paper.

Click here to download the Excel spreadsheet for Carnarvon

Note: Line numbers are provided in the linked Report for the convenience of fact checkers and others wishing to provide comment. If these comments are of a highly technical nature, relating to precise Bomwatch protocols and statistical procedures, it is requested that you email Dr Bill Johnston directly at scientist@bomwatch.com.au referring to the line number relevant to your comment.   


[1] Former NSW Department of Natural Resources research scientist and weather observer.