Climate change at Cairns
A climate science critique by Dr. Bill Johnston
Former senior research scientist, NSW Department of Natural Resources
Main points
* Like many of the Bureau’s historical datasets conditions affecting temperature measurements at the Cairns post office are largely unknown. As site changes in 1900 and 1924 occurred in parallel with observations an objective statistical method and post hoc attribution of changepoints as outlined previously for Gladstone Radar is preferable to relying on incomplete and possibly misleading metadata.
* Metadata incorrectly specifies location of the original aerodrome site near the 1939 Aeradio office and ignored the move to the mounded near the centre of the airport in Also ignored is that by September 1983 the site was moved again out of the way of a new taxiway. During construction when neither site was operational, aerial photographs show a fourth site was established on reclaimed land near the location of the current automatic weather station. Data from that site either in-filled the record or were used to adjust for the 1983 relocation. The highly significant step-change in 1986 plausibly marked when in-filling or adjustments ceased.
* Rainfall reduces Tmax 0.033 degrees C/100 mm and together with site changes accounts for 53.7% of Tmax variation. Step-changes at the post office in 1900, 1924 and 1929 and at the airport in 1986 caused 1.01 degrees C of warming in the data and there is no residual trend or change attributable to the climate.
Data sources
Daily weather observations are available for the Cairns post office (Bureau ID 31010) from 1 December 1889 and for Cairns airport (31011) from 22 October 1942. Post office data continued until 1953; however, in order to replicate ACORN-SAT – See Note 1 below, daily datasets were abutted from October 1942 and summarised into annual averages, counts of observations/yr and other attributes (Appendix 1).
Site changes at the post office and airport
No Australian weather station sites have stayed the same and as is the case for many historic datasets, recent (28 July 2018) site summary metadata for the Cairns post office provides no useful insights about conditions that affected early observations. A file at the National Archives of Australia (Barcode 3092148 See note 2 below) and photographs show the post office was moved and replaced in 1907-08 then replaced by a two-storey building in 1928. According to Torok (1996 See note 3 below) first correspondence with the Bureau was in April 1908; by 1924 the site was “hemmed in by buildings”; it moved in December 1929 to a “slightly more open site” then in 1943 observations transferred to the airport meteorological (met) office. Torok did not indicate when a Stevenson screen was first installed at the post office.
Note 1 http://www.bom.gov.au/climate/change/acorn-sat/documents/ACORN-SAT-Station-adjustment-summary.pdf
Note 2 Search barcodes at: http://soda.naa.gov.au/barcode/
Note 3 Torok S.J. 1996. The development of a high quality historical temperature data base for Australia. PhD Thesis, School of Earth Sciences, Faculty of Science, The University of Melbourne, Australia. p. 243 of 547 pp.
Established on a narrow strip of mangrove-mudflats and saltpans north of the town in 1934, the aerodrome was upgraded in 1936 – See note 1 below – to improve serviceability and the runway was reoriented on a sandy rise so it was not inundated during king-tides. Aeradio was installed by Amalgamated Wireless Australasia for the Civil Aviation Board in 1939 to track aircraft and advise of inclement weather. Observers trained by the Weather Bureau used theodolites to track hydrogen filled balloons to monitor windspeed and direction, undertook 3-hourly observations and made short-term forecasts (Figure 1). A 2012 station list (which is no longer in the public domain) places the original met-enclosure on the western side of the main runway northwest of the current general aviation precinct at Latitude -16.8736 degrees, Longitude 145.7458 degrees, which are the same coordinates as the current site. However, a 1959 aerodrome plan (National Archives of Australia Barcode 1602351 p. 156) and a 1952 aerial photograph (Figure 1) shows the enclosure about 90m north of the Aeradio office adjacent to the apron (Latitude -16.8820 degrees, Longitude 145.7489 degrees).
Figure 1. Cairns control tower and Aeradio office in c. 1959 (left). The 40-foot (12m) anemometer and windvane (usually mounted on the roof) charted windspeed, duration and wind direction. The signal square in front of the control tower was used for emergency visual communication. Radio operators originally occupied one side of the 1940s Aeradio office and met-staff the other and a vestibule was used for pre-flight pilot briefings. In 1946 functions were split between the Department of Civil Aviation, which later became Flight Services (responsible for air-traffic control) and the Weather Bureau, which became the Bureau of Meteorology. (Photographed from airside courtesy of the Civil Aviation History Society (CAHS)). An airside view of the operating precinct in 1952 (right) shows the main hanger (h), control tower (t), operations centre (o), met-office (mo) and met-enclosure (m) (portion of QAP0298012 – see note 2 below; 30 June 1952).
Recent site summary metadata (28 July 2018) places the 1941 Aeradio site on the eastern side of the main runway beside Swampy Creek implausibly some 1200 m distant from the office (Latitude -16.8872 degrees, Longitude 145.7572 degrees). However, a 1946 aerodrome-map (NLA Barcode 1724185), the 1959 aerial photograph in Figure 1 and aerial photographs in 1968 and 1984 (QAP1774012 and QAP4288118) show it was never located there. The ACORN-SAT catalogue – see note 3 below (p. 17) does not reference the original site, but notes that “In December 1992 the site moved 1.5 km northwest (to the other side of the runway)”.
In about 1960 negotiations commenced with the Department of Civil Aviation to relocate the instrument enclosure away from the terminal area, which together with runways and taxiways were to be redeveloped. Options were canvassed (NAA Barcode 1602351 p. 47 and 49); however, the suggested new location (p. 156) was rejected in favour of another site on swampy ground close to the 36-foot high (10.9 m) anemometer-mast near the centre of the airport (-16.8836o, 145.7489o) (p. 24). Work commenced in September 1965 to raise the level of the new site above the natural ground surface and it became operational in the first half of 1966.
Note 1 https://trove.nla.gov.au/newspaper/rendition/nla.news-article41750487
Note 2 https://qimagery.information.qld.gov.au/
Note 3 http://www.bom.gov.au/climate/change/acorn-sat/documents/ACORN-SAT-Station-Catalogue-2012-WEB.pdf
Coincidentally, upper-air wind-finding radar was installed in a new building across the road from the Aeradio met-enclosure.
Between June 1982 and September 1983 the main runway was extended northwards and a start was made on constructing new aprons, terminals and facilities on reclaimed land on the eastern side. Developments included construction of a taxiway, which required the 1966 mounded site to be moved to another mound about 170 m southeast (Figure 2). During construction neither site was operational and a fourth site was apparently established on reclaimed land close to where the current automatic weather station (AWS) is located. QAP4045227 (25 June 1982) QAP4193015 (11 September 1983)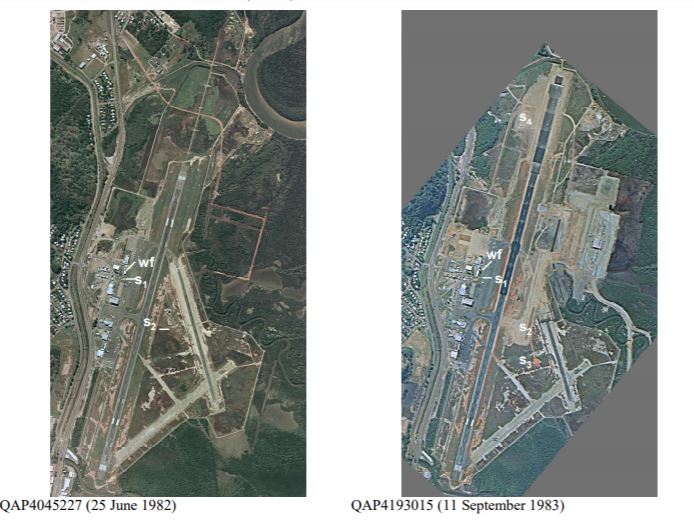
Figure 2. Changes at Cairns airport between June 1982 and September 1983 included lengthening of the main runway and obliteration of the WWII-era diagonal runways; commencement of construction of the new domestic and international terminals and associated works and construction of a N-S taxiway. According to metadata the wind-finding radar (wf) was installed in 1966; the original 1939 Aeradio site (S1) moved to the centre of the airport (S2) also in 1966. Construction of the taxiway required the site to move 170 m SE of its previous position before September 1983 (S3) and a fourth site (S4) was also established around that time close to the location of the current site. (Sites S2 and S3 were not operational at the time of the photograph.)
Metadata did not provide coordinates for the original site neither is there a record of the site having moved in 1966 and 1983. Establishment of the S4 site is also not documented. Considering that the S3 site was considerably disturbed, it appears that the S4 site was used to in-fill data and smooth the transition between sites at least until 1985. Although Site S3 is visible in the earliest Google Earth Pro satellite image (13 February 2002) it seems that observations ceased there in December 1992.
2.1 Metadata can’t be trusted.
Although critical to understanding factors affecting data, metadata mis-specifies location of the original site, timing of the moves in 1966 and before September 1983, establishment of the current site earlier than December 1992 and possible changes there related to instrumentation (installation of a 60-litre screen is not specifically mentioned for instance).
In addition to site moves and changes, developments in the vicinity (Figure 3) also potentially affected trajectory of data including lengthening of the runway to 1730 m in 1949, to 2020 m in the mid-1960s, 2600 m in 1982 and 3196 m in 1997. The potential for natural cooling was further reduced when some 65 ha of former open space was replaced by taxiways, hardstanding and new air-conditioned terminals 400 m east of the weather station between 1984 and 1997.
Even though such changes may not result in shifts in mean-Tmax, they may contribute additional variation (wind from certain directions may be warmer for example).
(a) 7 August 1952 (QAP0298012) (b) 5 April 1968 (QAP1774012)
(c) 6 September 2005 (QAP6165059) (d) Satellite image 10 October 2017 Figure 3. Time-lapse aerial photographs and recent Google Earth Pro satellite images reveal extensions to the runways, development of new terminals and changes to the layout of Cairns airport between 1952 when it was a small military aerodrome and 2017 when it had one of the longest runways in Queensland. Also shown are the locations of the 1940s met-office and met-enclosure (mo and S1), the 1966 and 1983 sires (S2 and S3) and the post-1994 AWS site (S4). There is no evidence that a met-enclosure was ever located beside Swampy Creek at Latitude -16.8872 degrees. Longitude 145.7572 as indicated by site-summary metadata (marked by the “?”).
Part 1 of this series outlines the analysis approach, which is independent of metadata. Additional context is provided in this paper by also considering daily and annual rainfall.
Results
3.1 Rainfall
Although clustered into moist and dry epochs related to the El Niño southern oscillation, rainfall since 1890 is homogeneous and untrending (Figure 4).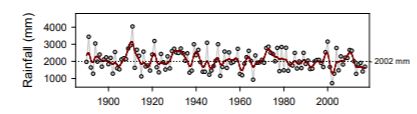
Figure 4. The spline curve (SmoothPAST = 7.0) tracks clustering of annual rainfall into moist and dry episodes.
Overall trend is not significant (Punc = 0.152) and there are no detectable shifts in the mean or meaningful cycles indicating the climate changed. (Median rainfall is 2002 mm.)
Frequency – ( Daily rainfall frequency is expressed as percentage of raindays (rainfall >0.1mm) within classes or relative to the overall median daily rainfall (MDR).)
– of low rainfalls (rain/wet day <1 mm) was under-reported at the post office relative to the airport (~15% vs. 25% of raindays/year) and over-reported at the airport after 2002 (~30% of raindays/year). This caused the frequency of daily values less than the rainday median (4.3 mm/day) to be higher at the expense of rainfalls greater than 4.3 mm/day (Figure 5).

Figure 5. Deviations from the long-term wet-day median daily rainfall (4.3 mm/day) are expected to be random and unrelated to site changes. However, daily rainfalls less than 4.3 mm were under-reported at the post office (small falls were either ignored or they accumulated in the gauge) and over-reported at the airport after 2002 (grey circles) and conversely for daily rainfalls >MDR (red squares). As frequency is affected by site changes in 1929, 1972 and after 2002, data are not homogeneous. (A 5-inch (127 mm) raingauge was used at the airport (vs. 8-inch (203 mm) at the post office) and it seems that measurements transitioned to a 203mm tipping-bucket gauge after c. 2002 when manual observations probably ceased.) (By definition, frequency
MDR is mirrored by frequency 0.1mm) within classes or relative to the overall median daily rainfall (MDR).

Figure 6. Abutted Cairns post office and airport Tmax aligned with documented site changes. Note that a Stevenson screen may not have been installed before 1900. The first stage of airport redevelopment from 1982 (red squares) included an extension of the main runway and construction of the terminal, control tower, taxiways and aprons and associated works east (seaward) of the runway.

Figure 7. In (a) rainfall reduces Tmax 0.032 degrees C/100 mm but explains only 12.0% of overall Tmax variation.
Variation that is not explained includes effects of site changes, which are embedded in re-scaled Tmaxrainfall residuals (b). Statistically significant step-changes (solid line in (b)) are unrelated to rainfall.
Segments whose median rainfall-adjusted means are the same (i.e. which are statistically coincident) are indexed the same (solid and open same-symbols) and reanalysed. Free-fit regressions ((c) to (e)) are parallel (responses to rainfall is the same) but relative to median rainfall and average Tmax, relationships are offset (regressions are free-fit to show slopes are not coerced to be the same). Multiple linear regression (f) confirms that individual regression are parallel (interaction is not significant) and offset, rainfall reduces Tmax 0.029 degrees C/100 mm overall and 53.7% of Tmax variation is explained.
At the same level of rainfall (2002 mm), step-changes in Figure 7(b) cause 1.01 degrees C of overall warming in the data. Multiple linear regression residuals are normally distributed and independent, variance is the same across categories and there is no residual overall trend indicating the climate has changed or warmed. Post hoc analysis of segmented trends also confirms that data consist of untrending segments separated by step-changes caused by site changes – buildings and redevelopment at the post office and a change at the airport in 1986, either due to developments east of the runway associated with Stage 1 construction of the new terminal complex, an undocumented move, or change resulting from smoothing the transition 7 between the 1966 and 1989 sites. There is no evidence that the original Aeradio site was on the eastern side of the WWII-era N-S runway (which appears to have been decommissioned before 1968 (aerial photograph QAP1774012)) adjacent to Swampy Creek. As rainfall explains 19.4% of variation not explained by step-changes alone it is highly influential on Tmax.
Discussion and conclusions
5.1 Rainfall
While annual rainfall is episodic and homogeneous, site and instrument changes (post office vs. airport and manual vs. tipping-bucket gauges) affect the distribution of daily values. An increase in the average number of wet days from 133 to 154/yr in 1930 likely reflected a change in exposure than a change in the climate. While frequency of raindays less than 25 mm/day has increased, frequency of rainfalls exceeding 25 mm/day is unchanged, thus there is no evidence that the frequency of extreme rainfalls has increased.
5.2 Maximum temperature Maximum temperature observed at a point on the landscape reflects interaction between atmospheric (synoptic) and local surface energy balance processes as modified by ambient conditions. Consistent with the First Law theorem that energy is conserved, the Tmax ~ rainfall relationship is highly significant (PregZero <0.001). However, as the relationship is imprecise (R2 adj = 0.120 (12.0%)) much noise is unexplained. Known as missing variable bias, lack of precision arises because site-factors affecting observations at the post office and airport are not accounted for by the naïve case. The underlying problem is that exposure and orientation of the post office Stevenson screen and undocumented changes at the airport can’t be resolved using metadata alone. Conditions in the post office yard are unknown while at the airport, location of the original Aerado site, subsequent relocations and possible adjustments to account for those using pre-1992 data from the current site are not detailed.
Metadata also does not describe other changes that possibly affected measurements. Reduced evaporation must increases heat advection to the local atmosphere and it is unlikely that replacing the post office with a larger 2-storey building in 1928 or replacing 65 ha of former mangrove flats with concrete, bitumen and air-conditioned multi-level terminals at the airport would not impact on temperature measured nearby. Furthermore, aerial photographs and Google earth Pro satellite images show the post-1992 site at the airport was infilled while bare ground indicates surrounding grass is sparse and unlikely to use water at the same rate as the vegetation it displaced.
* Despite repeated assurances by Bureau scientists that the history of ACORN-SAT sites has been exhaustively researched e.g. E.g. http://www.bom.gov.au/climate/change/acorn-sat/documents/ACORN-SAT_Report_No_3a_WEB.pdf (p. 28) ), metadata for Cairns is unreliable and misleading. The influential change in airport Tmax in 1986 is most likely due to adjustments made to account for the move from the 1966-mound to the new site in 1983, which is undocumented by metadata. Although site moves did not directly impact on Tmax it is nevertheless important that they (together with in-house adjustments to data are diligently reported.
* Data consist of untrending segments disrupted by step-changes related to site changes.
Changes at the post office in 1900 (possible installation of the Stevenson screen), 1924 (buildings) and 1929 (move) and the airport in 1986 directly result in 1.01oC of warming in Tmax data, which is unrelated to the climate.
* Rainfall reduces Tmax 0.033oC/100 mm and together with site changes accounts for 53.7% of Tmax variation. There is no residual signal indicating the climate has changed or warmed.
1 E.g. http://www.bom.gov.au/climate/change/acorn-sat/documents/ACORN-SAT_Report_No_3a_WEB.pdf (p. 28)
Appendix 1. Average annual Tmax and rainfall summarised from daily observations used in the analysis.
Year Rainfall AbsHiC AbsLoC YrAvoC YrMedian YrN YrSkew YrKurt YrSD YrVariance
1890 1965.8 34.6 19 28.26077 28.8 362 -0.40799 -0.17667 2.696629 7.271809
1891 3436.3 36 20 27.80139 27.6 360 0.135838 -0.68671 3.035147 9.212115
1892 1637.9 35.7 20.6 28.97328 29.4 363 -0.56543 0.124993 2.680815 7.18677
1893 1275.5 39.5 20.7 29.32 29.7 365 -0.11981 0.184058 3.052356 9.316879
1894 3041.9 37.9 21.2 27.88384 27.9 359 0.019498 -0.28281 2.876366 8.273481
1895 1979.1 35.1 19.9 28.03049 28.1 364 -0.25943 -0.56219 2.863829 8.201519
1896 2393.8 35.9 20.7 28.20955 28.4 335 -0.05832 -0.82596 3.00213 9.012783
1897 1684.5 36.6 22.7 29.00412 29.4 364 -0.06217 -0.56975 2.663209 7.092683
1898 2111.9 34.7 21.3 28.65344 28.8 363 -0.17666 -0.88374 2.857984 8.168075
1899 2232.6 36.7 17.3 28.32355 28.4 361 -0.10043 -0.07025 3.111944 9.684194
1900 1832.8 37.2 22.8 29.80531 30.1 320 -0.48337 0.801874 2.13314 4.550285
1901 2203.7 36.1 21.1 28.70347 28.9 346 -0.23177 -0.45596 2.884419 8.319872
1902 1278.6 37.4 21.8 28.77765 28.75 340 0.062712 -0.84282 3.234179 10.45991
1903 2542.3 38.4 22.8 28.95937 28.9 347 0.258764 -0.27051 2.821755 7.962304
1904 1590.5 35.6 22.2 28.96914 28.9 324 -0.06845 -0.74687 2.745236 7.53632
1905 1530.3 37.8 22.8 30.33371 30.6 267 -0.1504 -0.75467 3.021649 9.130363
1906 2111 34 22.8 29.36921 29.4 315 -0.22092 -0.54007 2.39359 5.729272
1907 2179 37.8 20.6 29.68886 29.4 350 0.107125 -0.66734 3.144753 9.889474
1908 2131.7 37.3 21.7 28.8989 28.9 365 0.110468 -0.62889 3.085067 9.517636
1909 2750 35.3 23.1 29.14254 28.9 355 0.020875 -0.6735 2.456783 6.035785
1910 2927.7 36.4 20.2 28.84588 28.3 364 -0.01046 -0.40088 2.915742 8.501553
1911 4031.1 38.4 21.1 28.8326 28.8 365 0.009225 -0.63847 3.138726 9.851599
1912 1620.4 37.2 22.2 29.54701 30 334 -0.1377 -0.72622 2.824109 7.975592
1913 2673.8 36.2 21.2 28.98061 28.8 361 0.088826 -0.95816 3.155817 9.959179
1914 2320.5 38.4 21.1 28.40164 28.3 365 0.168176 -0.19504 3.245131 10.53088
1915 1119.5 39.2 23.3 29.94214 30 337 0.090703 0.05573 2.750585 7.565719
1916 2566.5 37.7 21.9 29.53068 29.7 365 -0.09132 -0.95814 3.105055 9.641364
1917 1697.4 35.5 20.6 29.56923 29.8 364 -0.32756 -0.57478 3.124001 9.759381
1918 1757.2 37.2 21.4 29.60959 29.2 365 0.028737 -0.94006 3.363882 11.3157
1919 1460.4 37.2 20.6 28.93846 28.85 364 0.069131 -0.89212 3.098112 9.598296
1920 2395.8 35 20.9 29.11066 29 366 -0.06895 -0.39505 2.595258 6.735366
1921 3185.9 34.9 21.7 28.65808 28.4 365 -0.04818 -0.50033 2.413042 5.822771
1922 1649.8 38.4 17.5 29.69011 30 364 -0.23598 -0.12196 3.331023 11.09571
1923 1356.1 43.2 23.3 30.42247 30.3 365 0.353712 0.350758 3.15551 9.957241
1924 2431.1 40 23 30.0929 30 366 0.269648 -0.33985 3.209831 10.30302
1925 1944.6 37.4 22.2 29.36006 29.1 363 -0.02284 -0.64931 2.853316 8.141411
1926 1517.1 35.6 23.9 29.99616 30 365 -0.25778 -0.37786 2.335756 5.455754
1927 2290.5 37.8 18.1 29.34093 29.4 364 -0.1442 0.575454 2.786182 7.76281
1928 1584.2 36.1 22.6 29.61315 30 365 -0.29121 -0.75632 2.85142 8.130596
1929 2598 40.6 18.9 29.50169 29.4 355 0.082559 -0.26503 3.350394 11.22514
1930 2733.5 36.7 23.9 29.98926 30 363 -0.05803 -0.52245 2.481294 6.156818
1931 2510.3 39.4 22.7 29.3843 29.4 363 0.335693 0.187882 2.621132 6.870333
1932 2485.9 35 22.2 28.98849 30 365 -0.37611 -0.98198 2.977919 8.867999
1933 2750.1 38.3 20.6 28.76575 28.9 365 -0.093 -0.6565 3.093356 9.568851
1934 2473.5 38.9 20.8 28.37555 28.3 364 0.270537 0.328083 2.986735 8.920585
1935 2033.2 41.4 20 28.69589 28.3 365 0.583201 0.421662 3.480402 12.1132
1936 2470.5 36.7 14.7 28.29563 28.3 366 -0.58724 1.673647 2.75019 7.563542
1937 1335.2 36.9 21.4 28.68192 28.8 365 -0.1804 -0.16021 2.799392 7.836595
1938 1453.3 35.3 14.3 28.89835 29.15 364 -0.7104 1.338766 2.706038 7.322642
1939 2993.5 37.7 21.4 28.32849 28.2 365 -0.02121 -0.45117 2.671699 7.137977
1940 2354 36.8 23.2 28.58301 28.3 365 0.226069 -0.7031 2.723733 7.418722
1941 2670 36.6 22.3 28.12164 28 365 -0.01883 -0.75765 2.678649 7.175162
1942 1948.5 37.1 20 28.94959 28.9 363 0.119869 0.795044 2.350577 5.525214
1943 1390.6 37.9 22.2 28.88122 29.25 362 2.72E-05 0.773237 2.478714 6.144023
1944 1387.6 35.8 20.9 28.36236 28.55 356 0.05891 -0.64362 2.893293 8.371143
1945 3083.4 34.2 21.7 28.773 28.8 363 -0.10854 -0.5777 2.521036 6.355623
1946 1218.2 37.2 22.3 28.97562 29.1 365 0.00918 -0.54792 2.752089 7.573992
1947 1461.1 36 22.4 29.06088 29.1 363 0.004363 -0.784 2.680462 7.184874
1948 1722 35.7 19.9 28.70082 29.15 366 -0.29455 -0.74546 2.685644 7.212684
1949 2043.1 36.3 20.9 28.32727 28.4 363 -0.15685 -0.84297 2.944233 8.668508
1950 2998.6 35.5 19.5 28.51934 28.4 362 -0.09452 -0.41206 2.802682 7.855027
1951 1149.9 36.8 22.4 28.82192 28.9 365 -0.13285 -0.73746 2.580817 6.660617
1952 1670.3 36.1 21.8 29.51753 29.7 365 -0.35078 -0.59875 2.638029 6.959197
1953 2569.3 34 22.6 28.82055 29.3 365 -0.22184 -0.96698 2.676791 7.165208
1954 1611.2 33.9 22.2 28.65604 28.7 364 -0.12175 -1.01749 2.694652 7.261148
1955 2520.7 35.6 21.1 28.77225 28.9 364 -0.26758 -0.40043 2.636243 6.949779
1956 1895.6 36.8 20.4 29.28443 29.6 366 -0.08169 0.143201 2.767087 7.65677
1957 1960.8 35.1 21.7 28.63151 28.8 365 -0.10941 -0.7184 2.541354 6.458483
1958 2089.7 39 22.3 29.27699 29 365 0.401619 0.514071 2.580243 6.657656
1959 2731.9 37.2 20.6 28.38521 28 365 0.309379 -0.53459 3.206381 10.28088
1960 1262.6 37 21.3 28.75656 29.3 366 -0.30084 -0.46776 2.829686 8.007121
1961 1182.8 34.5 20.6 28.83644 29.1 365 -0.2926 -0.74433 2.790046 7.784355
1962 1858.6 35.1 22.4 29.02198 29.35 364 -0.31942 -0.7956 2.701782 7.299626
1963 2240 37.4 21.9 28.58984 28.65 364 -0.07975 -0.03792 2.638647 6.962458
1964 2614.8 37.4 22 29.19274 29.5 358 -0.19373 -0.23639 2.434234 5.925493
1965 2031 34.5 19.3 28.38137 28.5 365 -0.45064 0.03034 2.51375 6.318938
1966 928.1 37.2 23 28.86621 29.1 364 -0.03706 -0.26724 2.396091 5.741252
1967 2340.3 40.4 19.5 28.80879 29.1 364 0.240019 0.831302 2.833581 8.029179
1968 1912.4 34.4 21.7 29.07808 29.4 365 -0.39245 -0.60088 2.522952 6.365288
1969 1938 38.9 21 29.09479 29.3 365 -0.09632 0.405376 2.606385 6.793242
1970 2090.6 35.1 18.7 29.12274 29.2 365 -0.303 0.167059 2.432383 5.916487
1971 1912 39.4 20.7 29.25956 29.2 361 0.31045 0.320514 2.992876 8.957304
1972 2780.1 36.7 21.4 28.26257 28.15 366 0.249745 -0.34814 2.750939 7.567664
1973 2851.8 35.5 23 29.22356 29.3 365 -0.06038 -0.18911 2.161322 4.671311
1974 2498.5 36 20.8 28.75726 29 365 -0.2249 0.066825 2.405644 5.787124
1975 2428 36.6 21 28.73452 28.9 365 -0.34961 0.232602 2.290248 5.245234
1976 2000.1 35.8 22.1 28.86311 28.6 366 0.101484 -0.52554 2.732359 7.465786
1977 2783.9 37.1 21.4 28.56192 28.5 365 0.090497 -0.26805 2.540259 6.452914
1978 1425 36.1 22.2 28.74493 28.7 365 -0.0288 -0.06218 2.297121 5.276767
1979 2835.8 33.5 21.3 28.57836 28.8 365 -0.28379 -0.39971 2.38665 5.696096
1980 1471.8 35.1 22.7 28.75068 28.8 365 -0.05462 -0.6181 2.423722 5.874429
1981 2793.6 36.3 23.2 28.79918 28.7 365 0.260999 -0.33581 2.478141 6.141181
1982 1445.4 36.5 22 28.34451 28.3 364 0.118577 -0.71201 2.925832 8.560493
1983 1821.8 37.5 19.8 29.06411 29.4 365 -0.11669 -0.14642 2.745996 7.540494
1984 1752 39.2 21 28.8306 29 366 -0.08256 0.878366 2.446858 5.987116
1985 2490.2 35.8 21.6 28.79066 29 364 -0.25298 -0.64679 2.821468 7.960684
1986 1578.2 36.6 23 29.33709 29.35 364 -0.04769 -0.45181 2.44891 5.997161
1987 1993.4 36.9 21.6 29.07445 29 364 -0.11347 -0.50143 2.632752 6.931384
1988 1602.2 37 22.8 29.59781 29.75 366 0.049365 -0.24021 2.558691 6.546899
1989 2493.4 35.4 21.8 28.98626 29.2 364 -0.51145 -0.28634 2.671929 7.139205
1990 1842.2 36.6 20.5 29.3467 29.4 364 -0.19245 -0.40845 2.899476 8.406959
1991 2046 39.1 22.5 29.08956 29.1 364 0.201843 0.005981 2.449108 5.998128
1992 1546.8 39.1 22.7 29.41885 29.4 366 0.399928 0.485651 2.723515 7.417534
1993 1574.2 37.7 22.3 28.75315 28.6 365 0.250583 -0.01715 2.389025 5.707442
1994 1990.4 40 22.5 29.10575 29 365 0.383083 0.129853 2.932781 8.601203
1995 2074.8 40.5 19.1 29.43945 29.8 365 -0.04453 0.48467 3.074359 9.451681
1996 2083 36.4 21 29.33224 29.65 366 -0.1978 -0.25317 2.430897 5.909259
1997 1899.8 33.4 21.7 28.59562 28.7 365 -0.20647 -0.66652 2.364407 5.59042
1998 1664.8 37.2 22.6 29.98521 30.1 365 -0.25863 0.316229 2.188996 4.791704
1999 2534.6 35.7 20.8 29.01945 29 365 -0.13031 0.358503 2.278008 5.189318
2000 3148.8 34.9 21.5 28.64 28.9 365 -0.45264 -0.3258 2.506659 6.283341
2001 1667.8 36.4 24.2 29.41205 29.3 365 0.172774 -0.51498 2.22658 4.957656
2002 721 37.4 23.3 29.83315 30.1 365 -0.05813 -0.53085 2.500488 6.252442
2003 1279.2 35.6 23.4 29.39479 30 365 -0.3715 -0.73189 2.400641 5.763077
2004 2777.6 35.2 22.7 29.11448 28.9 366 -0.04281 -0.63008 2.377943 5.654612
2005 1470.8 36.1 22.1 29.43151 29.4 365 -0.11018 -0.7803 2.786776 7.76612
2006 2289 35.3 22.5 28.91671 28.9 365 -0.0701 -0.60605 2.459523 6.049253
2007 1813 37 21 29.24712 29.8 365 -0.52011 0.042072 2.779126 7.723543
2008 2215.2 36.4 22 29.36466 29.6 365 -0.19547 -0.31214 2.655625 7.052346
2009 2199.4 33.9 22.6 29.67315 29.9 365 -0.48423 0.03418 2.017626 4.070816
2010 2659.8 36.9 23.4 29.71753 29.8 365 0.121298 0.277769 2.094569 4.387219
2011 2623.2 35.8 22.5 29.13096 29.5 365 -0.1813 -0.70359 2.437212 5.94
2012 2003.4 34.9 21.9 29.36967 29.8 366 -0.38421 -0.50367 2.709149 7.339489
2013 1268.6 38.6 23.8 29.56548 29.5 365 0.299878 0.44112 2.365796 5.596992
2014 1826.6 34.8 20.3 29.31973 29.5 365 -0.38675 -0.09602 2.570414 6.607027
2015 1906.4 36.5 22.5 29.52712 29.4 365 0.013212 -0.30972 2.544646 6.475224
2016 1406.4 37.9 23.7 30.14836 30.4 366 -0.12508 -0.45576 2.547485 6.489682
2017 1688.6 36.2 23.3 29.90986 29.7 365 -0.13507 -0.4081 2.461642 6.059683

Analysis is resolved when:
(i) Median-rainfall adjusted differences between segment means are different (Cases (iii) and (v))
(ii) Interaction is not significant (Case (iv) fails the criterion).
(i.e. individual regressions are parallel and offset.)
Subsidiary requirements are that AIC is minimised and that residuals are normally distributed, independent (not autocorrelated) and variance is the same across Shfactor categories (variance is homoskedastic).
Case (iii) is the most parsimonious statistical description of the data.