Dr. Bill Johnston[1]
Main Points
- Aerial photographs and archived plans and documents unequivocally show the Stevenson screen at Rockhampton airport moved about 450 m from beside the northern boundary of the aerodrome to a mounded site south of the runways before May 1956. The move was not reported in site-summary or ACORN-SAT[2] metadata and the substantial change in exposure appeared to have been adjusted-out of the data using parallel observations that continued possibly until the 1960s.
- A satellite communications unit (SatCom) installed within 25 m of the second site in 1986/87 caused maximum temperature to step-up 0.48oC. Also undocumented by metadata, the abrupt increase was ignored to imply it was due to the climate.
- The cause of an upward step-change in 2013 (0.95oC) was not specifically identified. However, as it was not related to site changes or the climate, it was either due to a local instrument fault or a problem with off-site data processing. Everything considered, it could not be ruled out that recent data were manipulated so daily maximum temperatures appeared warmer by up to 2.2oC on warm days.
- Adjusted for rainfall, site-related changes caused Tmax to warm 1.44oC overall and after step-changes and rainfall were accounted-for no unexplained changes or trends remained that could be attributed to the climate.
Background
The Rockhampton airport weather station (ID 39083) is an Australian Climate Observations Reference Network – Surface Air Temperature site used to estimate Australia’s warming. As is the case for other ACORN-SAT sites, since the early 1990s when they commenced homogenising Australian temperature data, Bureau climate scientists have claimed repeatedly that site-histories used to pinpoint changepoints and make adjustments were exhaustively researched. However, to their discredit, like at Cairns and Townsville, they ignored that the original meteorological enclosure at Rockhampton (Figure 1) moved about 450 m south to a substantially different exposure before May 1956. Furthermore, it appears the effect on data was adjusted-out using parallel observations that continued possibly until the 1960s.
As if to blame the climate, Bureau scientists also ignored that a satellite communications module (SatCom) installed close to the second site in 1986/87 (Figure 2) caused mean annual maximum temperature (Tmax) to abruptly step-up 0.48oC from 1987.
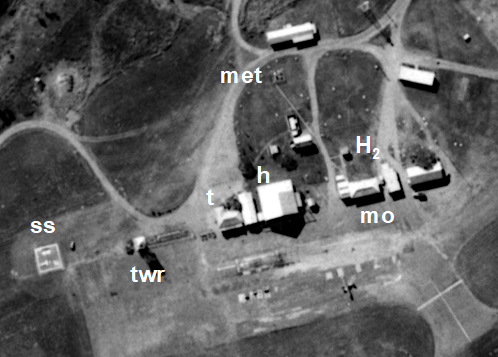
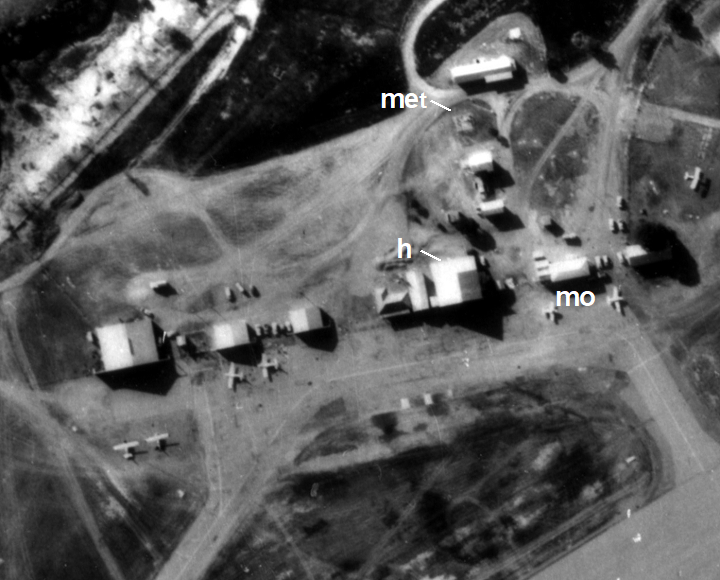
Figure 1. (Left) The original Rockhampton weather station (met) was located was located on the northern boundary of the aerodrome behind the Aeradio office (mo), which was established by Amalgamated Wireless Australasia on behalf of the Civil Aviation Board in 1939. Other buildings shown in the May 1956 aerial photograph were H2, the hydrogen generator for filling balloons used to estimate windspeed and direction; (h) the pre-WWII hanger, (t) the terminal, (twr) tower and signal square (ss) used for visual communication. Although Bureau staff moved to the new control tower complex in 1961, the met-enclosure was still maintained until at least June 1966 (right).
A step-change in 2013 (0.95oC) was not related to the climate but was caused by over-reporting of high-range daily values. The change appeared to have coincided with the AWS being hard-wired to the Bureau’s computers in Melbourne where data were processed into daily maxima, minima and 10-minute and half-hourly observations. As the Stevenson screen had been changed from 230 to 80-litres well before (on 22 March 2000) and no site changes were evident in satellite images; it was highly unlikely that while distributions of upper-range minimum temperatures (daily Tmin >18oC) were cooler after 2013, the highest 10% of daily observations (Tmax >33oC) were warmer by up to 2.2oC.
Further, while the record-highest temperature on 18 November 1990 (45.3oC) occurred before the site moved away from the SatCom and should be disregarded, it is implausible that the second highest value of 44.4oC on 28 November 2018 was 2.7oC over-range relative to the percentile distribution of pre-2013 data.
Although evidence was circumstantial, either the instrument, including its calibration was faulty or the problem occurred during processing. Given there were no parallel observations or a paper-trail, and bearing in-mind the Bureau’s penchant for declaring daily, monthly and annual ‘records’ somewhere almost every day, it cannot be ruled out that data were jigged higher on warm days.
Click here for full paper, photographs and tables of data.
Discussion
Moving a weather station is not a simple matter and it is not possible that the pre-1956 move was not recorded in Bureau files. It required negotiation with the Royal Australian Air Force and the Department of Civil Aviation; recommendations and approvals of expenditure at Director level; requisitions to the Department of Public Works (Cwth) for building the mound and installing equipment and it may have taken months to complete. Following the move parallel observations were made for several more years. Adding to the debacle, it appears data were changed to hide the move, which further undermines trust in the integrity of the Bureau’s data management processes.
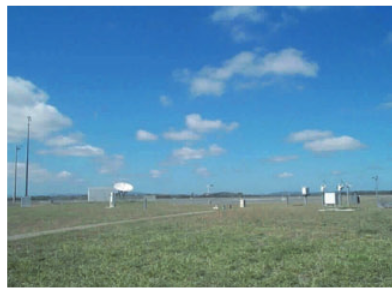
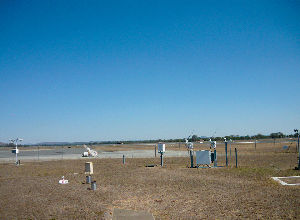
Figure 2. An undated oblique view of the Rockhampton weather station and large SatCom dish copied from a 2011 ACORN-SAT Station catalogue (left); and (right) the same site from a different perspective copied from the most recent catalogue. Installation of the SatCom in 1986/87 caused maximum temperature to step-up 0.48oC.
It is also not possible that observers were unaware that the SatCom was installed 20 to 30 m from the previous site in 1986/87 or that it generated heat that affected measurements. Also perverse is that the 1987 step-change, which was highly significant in both time and rainfall domains, was not detected or adjusted by data homogenisation. Likewise, multiple analyses of the 2013 step-change found it was due to either an instrument fault or off-site data processing, not the climate.
Despite at least four homogenisation iterations of the same data, failure to detect and adjust the 1987 step-change exposed major weaknesses in the Bureau’s methods. Homogenisation lacks scientific objectively, rigour and oversight; while picking and choosing changepoints and applying arbitrary adjustments allows changes and trends in homogenised data to be pre-determined.
Finally, at all levels (publication in scientific journals; the Bureau’s annual climate statements and reviews; CSIRO’s State of the Climate reports, supporting documents and advice to governments; grey-science news stories spread by the Climate Commission, the Conversation, the Climate Council, WWF and the ABC, in-house reviews and ‘independent’ technical audits) the peer-review process failed dismally to detect problems and biases.
Changepoint identification based on poorly researched and misleading metadata and application of arbitrary and inconsistent adjustments is neither credible nor scientific and should be abandoned.
An important link – find out more
Click here for full paper, photographs and tables of data.
The page you have just read is the basic cover story for the full paper. If you are stimulated to find out more, please link through to the full paper – a scientific Report in downloadable pdf format. This Report contains far more detail including photographs, diagrams, graphs and data and will make compelling reading for those truly interested in the issue.
Bill Johnston, 5 April 2020
Click here for full paper, photographs and tables of data.
[1] Dr. Bill Johnston’s scientific interests include agronomy, soil science, hydrology and climatology. With colleagues, he undertook daily weather observations from 1971 to 1979.
[2] Australian Climate Observations Reference Network – Surface Air Temperature
Australian climate records are a mess, as Harry from CRU found out.