Part 3. Climate change at Townsville
Dr. Bill Johnston
Main points
- Maximum and minimum temperature records (Tmax and Tmin) for Townsville airport (Bureau ID 32040) are dominated by poorly documented site and instruments changes. Aerial photographs, Royal Australian Air Force plans and documents and the Bureau of Meteorology’s Garbutt instrument file, which are available in the National Library or the National Archives of Australia show unequivocally that the Stevenson screen moved three or four times before 1969 while it was on the eastern side of the main runway and probably twice between when it moved to a mounded site on the western side in 1970 and the move in December 1994 to the current AWS-site where a 60-litre Stevenson screen is used in place of the previous the 230-litre screen.
- Independent statistical methods combined with post hoc research that identify then verify the effect of site and instrument changes on data overcomes the problem that not all site changes cause changes in data and not all changes are documented by site-summary or ACORN-SAT metadata.
- Site changes (the undocumented move from the vicinity of the Aeradio office to the aerosonde hut probably in 1953/4 and from east of the office to the mounded site in January 1970 and the documented move to the small screen and AWS in December 1994) account for all the warming in Tmax. Extending the met-office in 1968 resulted in late-afternoon shading in the vicinity of the met-enclosure, which is the most likely cause of the Tmin up-step in 1968.
- Accounting simultaneously for site-related changes and causal covariates (rainfall for Tmax and Tmax for Tmin) leaves no residual trend, change or cycles in residuals attributable to the climate, thus there is no climate change and no warming. Also, as no trend is detectable in segmented the step-change model best describes the data (i.e. as data are not homogenous a naïve trend model is not applicable).
- By ignoring changes that happened and adjusting for changes that did not impact on data, trends can be gamed to imply the climate has changed or warmed when it has not.
1. Background
Home to James Cook University’s ARC Centre of Excellence for Coral Reef Studies[1], the Great Barrier Reef Marine Park Authority[2] the Australian Institute of Marine Science[3] and with collaborative links to the University of Queensland, The Australian National University, University of Western Australia and CSIRO; and the Great Barrier Reef Foundation and the Global Change Institute (both located in Brisbane), Townsville is the epicentre of multi-billion dollar research projects that focus on the Great Barrier Reef.
Note 1. https://www.coralcoe.org.au/about/the-centre-of-excellence Note 2. http://www.gbrmpa.gov.au/ Note 3. web@aims.gov.au
As all the institutes and their professors, the Government of Queensland and especially the Great Barrier Reef Foundation believe climate change is the single most important threat to the reef[4] [Note 4. E.g. http://www.gbrmpa.gov.au/our-work/threats-to-the-reef/climate-change and https://www.barrierreef.org/?gclid=EAIaIQobChMIp4XMrpSw3wIVGyQrCh3uWQfnEAAYASAAEgLXVPD_BwE] it is timely to examine how the local climate has changed since records commenced at Townsville aerodrome in 1940. The following study aims is to quantify changes in Townsville’s climate and how those might impact on the Great Barrier Reef.
1.1 Data sources
Daily maximum and minimum temperature (Tmax and Tmin) for Townsville Aero (Bureau ID 32040) downloaded from the Bureau of Meteorology’s Climate Data online facility were summarised into annual datasets using the statistical package R[5] [Note 5. R Core Team (2016). R: A language and environment for statistical computing. R Foundation for Statistical Computing, Vienna, Austria. URL https://www.R-project.org/] and analysed using the same methodology case-studied in Part 1 using data for Gladstone Radar. As data for 1940 are incomplete, analysis commences in 1941.
1.2 History of the Townsville airport weather station
The original landing ground was established in the 1930s on a reserve about 9 km from Townsville south of a bend in the Ross River. Amalgamated Wireless Australasia established an Aeradio facility for the Civil Aviation Board in 1939 to monitor aircraft and inform pilots of inclement weather between Brisbane and Port Moresby. The 20 by 14 feet (6 by 4.3 m) one-room office (National Archives of Australia (NAA) Barcode 1711911[6] [Note 6. Search by Barcode at: http://soda.naa.gov.au/barcode/ ]) was manned by radio operators and observers trained by the Weather Bureau in Melbourne, whose duties included tracking weather balloons released at fixed-times to monitor windspeed and direction, observing surface weather usually at three-hourly intervals and preparing local forecasts and pre-flight briefings. Used as a fighter-base during WWII, maps in an NAA file (Barcode 171191) identify the cycle/walking path north of River Park Drive in the present-day suburb of Annandale (Latitude -19.30o Longitude 146.79o) as the original Ross River airstrip.
As the strip was boggy and not suitable for heavy aircraft, in 1939 the Council built another landing ground near the Garbutt meatworks railway siding north of the town. The new strip was immediately taken over by the Royal Australian Air Force (RAAF) as a forward operations base and developed into a heavy-duty multi-runway aerodrome, with the Council and Main Roads Commission undertaking construction. The Aeradio building, staff and equipment relocated to the civilian precinct (near the Ansett and ANA terminals) at Garbutt in about March 1940.
RAAF and Unites States Army Air Force (USAAF) meteorologists operated concurrently with Aeradio observers at least during the early days (Figure 1). RAAF meteorologists were housed separately (in Building 80), which was close to the HQ and signals buildings at the base while the USAAF’s 15th Weather Squadron apparently occupied another building north of the civilian terminals. Archived maps and plans show the RAAF and Aeradio (and possibly the USAAF) operated separate meteorological (met) enclosures, hydrogen generators and theodolite tracking equipment (e.g. NAA Barcode 1724184; 32458325). In 1941 plans were drawn for a new RAAF operations room (NAA Barcode 10282256; Building 81) to house various functions including signals, meteorology, navigation and crew briefing, which appears to be the RAAF HQ (Figure 1). On its completion, the RAAF met-enclosure apparently moved to a stage on the roof of Building 81.
Also in 1940, Aeradio staff were conscripted as a unit of the RAAF and by 1942 met-staff had apparently consolidated within the small Aeradio office, which required an extension to be added as an annex (NAA Barcode 966914, p. 44). An aerodrome map and aerial photograph show the instrument enclosure in a grassy area northeast of the office.
|
|
|
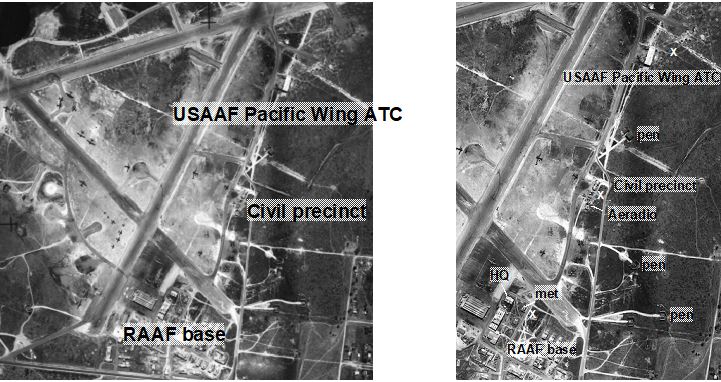
Figure 1. Garbutt aerodrome in 1943 (National Library of Australia uncatalogued print V293) showing buildings, aircraft dispersal areas, turning circles and splinter-proof pens. Prior to July 1943 the USAAF, Aeradio and RAAF operated separate meteorological enclosures (marked X). According to a file at the National Archives of Australia (NAA Barcode 966914) in 1944 the RAAF enclosure moved to the roof of “the signals and operations building No. 81”. By 1942 the relocated 4-person Aeradio office from Ross River reportedly housed 17 met-staff: nine RAAF and eight USAAF personnel and the building was extended by a 12 m by 9 m annex, which is visible in subsequent aerial photographs.
By 24 April 1944[7] [Note 7. Aerial photograph print 1132 (24 April 1944) https://nla.gov.au/nla.cat-vn4602228 ] another operations centre (presumably civilian) and store (building W101 and W102) were built north of the civilian precinct and a new met-enclosure and hydrogen shelter were situated nearby (Figure 2). After wartime arrangements ceased in July 1946 Aeradio moved to the Department of Civil Aviation (and later became Flight Services) and met-officers moved to the Weather Bureau within the Department of the Interior (which later became the Bureau of Meteorology). In 1948 a new met-office was planned (NAA Barcode 5051556) with its axis parallel to the main runway but when built it was reoriented 90o. At about the same time the former operations centre was refurbished as the terminal and Aeradio operators and met-observers were co-located in the new office.
According to NAA files, radio-aids offices were planned for Garbutt, Amberley, Cloncurry and Charleville airports in 1950 (e.g. NAA Barcodes 1021539 to 1021541). A February 1952 aerial photograph[8] [Note 8. Aerial photograph print 5005 (1 February 1952) https://nla.gov.au/nla.cat-vn4602275 ] and January 1954 aerodrome map (NAA Barcode 32458325) shows there were no developments west of the main runway until a new RAAF/DCA control tower and the Bureau’s met-aids building were constructed the following year in 1955.
The Bureau’s Garbutt instruments file (which is open and online at the National Archives of Australia (Barcode 12879364)) reports that on 6 March 1956 Cyclone Agnes blew down the Stevenson screen, which was near the aerosonde hydrogen shelter and all instruments were destroyed (p. 196). The replacement screen was apparently re-installed in a possibly pre-existing met-enclosure about 70 m east of the office (at Latitude ‑19.2558 o, Longitude 146.7722o (estimated using Google Earth Pro)) where it remained in service until 1970.
|
|
|
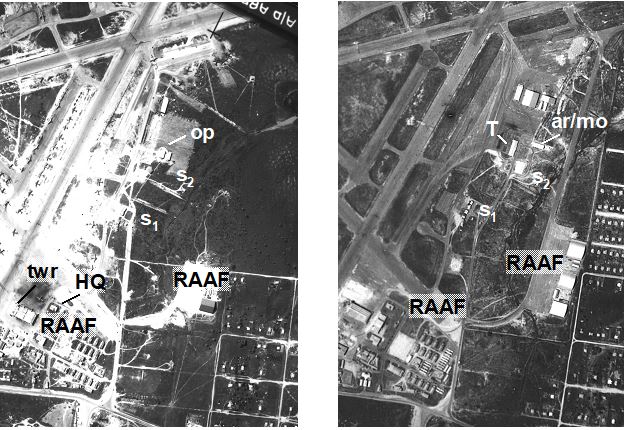
Figure 2. While the RAAF control tower (twr) was located at the end of the original hanger southwest of the HQ, a new operations (op) centre opened before 24 April 1944 (left). Also, while the Aeradio met-enclosure (S1) appeared to be operating, another site (and hydrogen shelter) opened on a raised pad south of the op-centre (S2). By 1 February 1952 (right) the op-centre has been reconfigured as the terminal (T), an Aeradio-met-office (ar/mo) was built perpendicular to the main runway and new RAAF hangers were in use. (In 1952 there were no buildings or developments west of the main runway.)
Further, in 1963 negotiations commenced with the RAAF to establish a new site, which would house all instruments and equipment in a single met-enclosure (instruments file p. 145). The location agreed to in 1965 was on the western side of the runway between the 1955 radio-aids building and new control tower complex (at Latitude -19.2510o, Longitude 146.7660o) (p. 111) (Figure 3). Specifications required the 100-foot (30 m) square area include a fenced 54-foot (16.5 m) square section built-up 3 ft (900 mm) above natural ground level topped with 12-inches (300 mm) of local topsoil and graded-off. Real-time temperature and humidity data sensed by a Fielden automatic weather station (AWS) located in the enclosure were to be relayed to the control tower and met-aids office. Building the enclosure and connecting telemetry cabling was completed by August 1968 (p. 74) and although observations commenced in 1969 it did not become the official site until 1 January 1970 (p. 69).
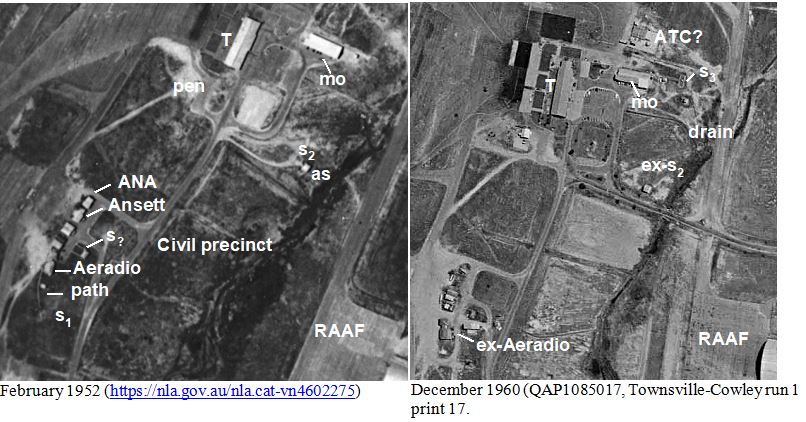
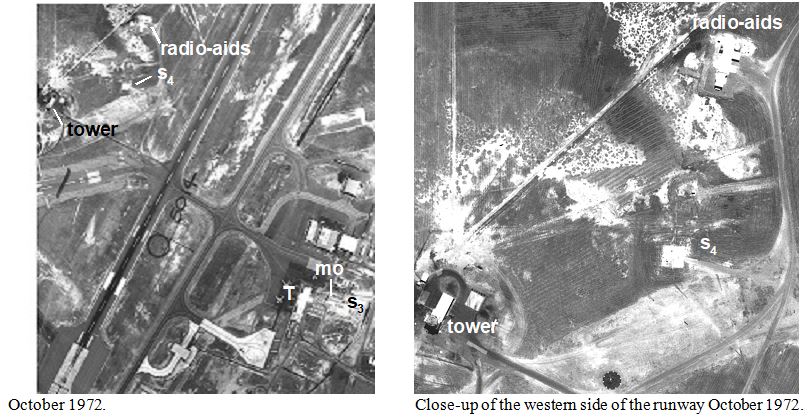
Figure 3. An overview of the various locations of the Townsville airport weather station before 1960 and the unconfirmed location of the aerosonde (as) site (S2) (top panels). (A map (NAA Barcode 1724184) shows the original Aeradio site may have been located as indicated by S?). Lower left: from 1 January 1970 observations transferred to a new site (S4) west of the main runway, which was raised about 2 m above the natural ground level (Portion of Townsville aerodrome CAS623, run 10, print 20, 19 October 1972 (https://nla.gov.au/nla.cat-vn4602323). Note the various trench-lines laid for telemetry between remote sensors and the tower.
Shortly after the Garbutt Instruments file closed (21 May 1974) another site commenced operating in the vicinity of the radio-aids office before 23 June 1976 (at Latitude -19.2500o, Longitude 146.7663o) (Figure 4). A new met-watch office was built 80 m west of the radio-aids building (which was subsequently demolished) and all staff co-located to the new office in February 1995. (The re-purposed met-office on the eastern side of the runway is still being used.) According to ACORN-SAT metadata[9] [Note 9. http://www.bom.gov.au/climate/change/acorn-sat/documents/ACORN-SAT-Station-Catalogue-2012-WEB.pdf ], observations transferred to an AWS and 60-litre screen at a new, mounded site 100 m northeast of the office on 8 December 1994.
1.3 Metadata is unreliable
According to 27 July 2018 site-summary metadata the 1940 Aeradio site was at Latitude ‑19.2492, Longitude 146.7647, which is the final location of the S5 site shown in Figure 4. The ACORN-SAT catalogue states: “Observations have been made at Townsville Airport since 1942. There are no documented moves until one of 200 m northeast on 8 December 1994, at which time an automatic weather station was installed. Observations at the new site were made under the original number, while the old site continued until December 2000 under the station number 032178.”


Figure 4. Changes at the Townsville radio-aids (r/a) office between 1976 and July 2002 (which is earliest Google Earth Pro satellite image) include that another site (S5) operated south of the office before 1976 (upper-left); the radio-aids office was replaced by a combined met-watch office (mo) and observers previously housed east of the runway moved there in February 1995. The radio-aids building was demolished before August 1995 (lower-left) but the S5 Stevenson Screen apparently continued to be used. No site was located at coordinates for the site referred to as ‘Townsville Aero comparison’ (032178) in 1995 (X); however the previous S5 Stevenson screen moved there by July 2002.
The Bureau’s Garbutt instruments file (p. 74, 191) indicates that the screen relocated from the radiosonde hut to near the office after Cyclone Agnes in March 1956 and that the radiosonde screen was sent to Boulia in October 1957 (p. 184). Aerial photographs and maps show it was the third (or fourth) relocation of the screen since it was installed near the Aeradio office in July 1940 (p. 229) (Figure 3). The file also details negotiations with the RAAF to establish the new mounded-site west of the runway and mentions that the protocol set out in Circular No. 66, para. 5(B) required observations to commence there from 1 January 1970. However there is no mention of the new site in metadata or of the three or four sites in the vicinity of the radio-aids/met-watch offices on the eastern side (Figure 4). Neither does metadata mention that a screen was installed south of the radio-aids building before July 1976 or that it moved again after 1995.
1.3.1 Uncertainties
High-level aerial photographs may be difficult to interpret and some features may not be well-contrasted depending on time-of-day and the angle from which they are taken. A map independently corroborates the original 1940 Aeradio site (designated S? in the February 1952 photograph in Figure 3). The path leading to an enclosure discernable in the original of the photograph points to the S1 site. The S2 site is difficult to identify possibly because there was no ‘site’ just a Stevenson screen used to baseline radiosonde flights, while the enclosure east of the office is clearly visible in 1952 but not 1947. A radiosonde building referred to the instrument file (p. 201) predates construction of the radio-aids facility on the western side of the runway but it is not referred to in any other file or plan available in the public domain. As there are no maps or aerial photographs available from QAP, Geosciences Australia or at the National Library between 1 February 1952 and 8 January 1959, site changes during that time cannot be collaborated. Nevertheless, it is unequivocal that observations transferred to the mounded site on the western side of the runway on 1 January 1970. Later (probably around 1976) another Stevenson screen was installed at the radio-aids building and that screen moved after 1995.
2. Statistical analysis
As outlined previously in Part 1, linear regression partitions between variation caused by a physically related covariable (deterministic variation explained by the regression equation) and variation that is unexplained by the naïve case. Additional signals such as cycles, step-changes ((Sh)ifts) and oscillations due for instance to the El Niño southern oscillation, which are not accounted for, result in non-random behaviour in residuals (Figure 5). Testing residuals for randomness, normality and independence verifies that hypothesised relationships reflect the data generating process.
3 Results
3.1 Preamble
Statistical tools used in the study are ‘blind’ to historical aspects of the site detailed in Section 1.2 and site summary (27 July 2018) and ACORN-SAT metadata. The approach therefore side-steps the problem that not all site changes are documented and not all documented changes necessarily impact on data.
Step-change analysis combined with multiple linear regression with the physically causal covariate as the control, and analysis of residuals is used to identify and compare site-change scenarios that plausibly explain Tmax and Tmin data. The disciplined outcome is that: (i), segmented regressions are offset relative to the covariate (covariate-adjusted segment means are different); (ii), slopes are homogeneous (interaction is not significant); (iii), statistical assumptions are verified and where two models appear to be equally plausible, provided number of rows are the same, the Akaike information criterion (AIC)[10] [Note 10. Burnham, K.P, Anderson, D.R and Huyvaert, K.P. 2011. AIC model selection and multimodel inference in behavioral ecology: some background, observations, and comparisons. Behav Ecol Sociobiol 65, 23-35. doi 10.1007/s00265-010-1029-6) ]identifies the most parsimonious. (As Stevenson screens may move to sites with similar ambience to a previous site, coincident segments are re-coded the same and reanalysed as a single group.)

Figure 5. Although naïve regression residuals (rescaled by adding grand mean Tmax) are normally distributed (Pnormal =0.68; Anderson-Darling test), the lag1 plot and Durbin-Watson test (P) indicates residuals are autocorrelated. Furthermore, step-changes show residuals are not time-random (c). Thus although 40.3% of variation is explained by the naïve case, the model is faulty and does not depict the data generating process.
3.2 Maximum temperature
Although all Tmax scenarios listed in Appendix 2 (Cases (iii) to (ix)) are analysed and compared, only Case (ix) meets the criteria that segmented regressions are parallel and offset relative to the covariate (rainfall) and that with all cases included AIC of competing models (Case (vi) vs. Case (viii)) is minimised (Figure 6). Sequential analysis found for instance, that mean-Tmax for the segment from 1941 to 1953 is the same as from 1970 to 1994 (Case (vii)), thus those segments were re-coded the same and reanalysed as Case (viii); also previously it was found that the step-change in 2015 (Case (v)) is possibly due to the shortness of the post-2015 record (more data is needed for the step-change to be confirmed).
Case (viii) is finally analysed with suspected outliers omitted (Case (ix)). Although it seems like splitting hairs, the most parsimonious model provides the best estimate of the median-rainfall adjusted cumulative sum of site related changes (0.83oC for Case (vi) vs. 0.58oC (Case (viii)) or with outliers omitted, 0.55oC). Changepoints that don’t fit the data such as Case (iv) and (v) result in wildly different StepSum estimates (0.99oC and 1.18oC) and are likely to be biased.
At each iteration residuals are examined for possible violations of linear regression assumptions, graphically, and using an overall global test (R package gvlma[11] [Note 11. https://cran.r-project.org/web/packages/gvlma/gvlma.pdf ]). Outliers are also examined and data segments are tested for within-segment trends (Table 1). (Data from 1954 to 1956 are problematic and further research suggests the site moved from the Aeradio site in 1953 or 1954 and the relocation in 1956 was not influential.)
Annotated within the caption, Figure 6 provides a graphical summary of Tmax analysis with shifts in Tmax ~ rainfall residuals aligned with changes that are either undocumented in Bureau metadata (the probable move in 1953/4 from the Aeradio site and the move to the mounded site in 1970) and the documented move to the current ASW site (where a 60-litre screen is used) on 8 December 1994. The shift in 2015 cannot be confirmed as significant (P = 0.064), possibly because there is insufficient data (2015 was also the driest year since 1941 and therefore likely also to be the warmest climatically). The final model (Case (ix) in Appendix 2) is depicted in Figure 6(f). An influence plot indicates data for 1941, 1944 and 1958 are out of range and probably influential on trend but were not excluded or investigated further.
Table 1. Trend analysis of individual data segments

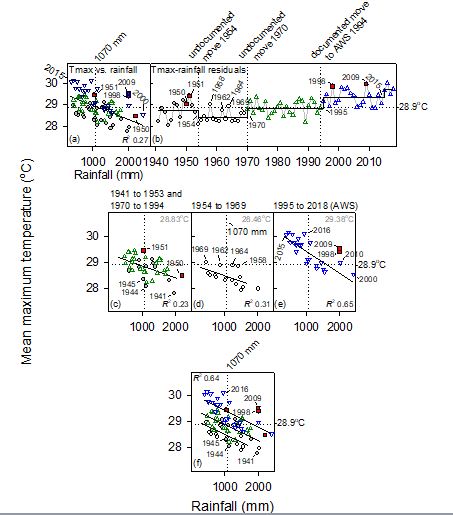
Figure 6. Due to outliers and embedded site-change effects, rainfall explains only 19.3% of Tmax variation overall (a). (Excluding data for 1950, 1951, 1998 and 2009 Radj increases to 0.274.) Residual step-changes in (b) align with undocumented relocations in 1953/4 (from the Aeradio office to the aerosonde) and 1970 (when observations transferred to the western side of the runway). The move to the new AWS-site and 60-litre Stevenson screen in December 1994 caused Tmax to increase from 24.46oC to 29.38oC (median rainfall adjusted) independently of the climate. While there is no difference in mean-Tmax between 1941 to 1953 and 1970 to 1994, the site behind the office (1954 to 1969) was cooler possibly due to irregular watering or closeness to the drain. Ignoring outliers (red squares) and although data for 1958, 1962 and 1964 appear to be anomalous, individual regressions (c) to (e) are significant, lines are parallel and offset and together with rainfall explain 64.3% of Tmax variation.
As residuals from the analysis are normally distributed, independent and variance is the same across categories (homoscedastic) no unexplained systematic rainfall-domain signal remains. Also, as no residual step-changes, trends or cycles are evident in the time-domain rainfall and step-changes in 1954, 1970 and 1994 account for all the warming in the data.
2.3 Minimum temperature
Dependence of Tmin on antecedent temperature was firstly evaluated by repeated sampling of daily Tmin, previous days Tmax and rainfall for the day, either as the amount of rain reported or rainfall incidence (ifRain qualitatively identified as 0 or 1). Data were sampled randomly at the rate of 10% of rows/year from 1941 to 2018 using the R package dplyr[12] [Note 12. https://cran.r-project.org/web/packages/dplyr/dplyr.pdf ]
For all of 10 rounds of sampling and analysis of the form (Tmin ~Tmax (+ Rain (or ifRain)) dependence on Tmax was highly significant (P <0.001) and including rainfall (or ifRain) increased variation explained from 58 to 60% (Tmax alone) to 63 to 65% (including Rain or ifRain). Positive rainfall coefficients show Tmin was higher on cloudy, rainy days, which is consistent with cloudiness reducing emissions of longwave radiation from the landscape to space, which reduces nighttime cooling.
Sequential covariate analysis of Tmin scenarios (Appendix 2) found the step-change in 1968 (Case (iv)) [or ignoring outlier data for 1941 and 1951 (Case (vii))], more likely explains the data than forcing a supposed change in 1970 corresponding with the move (Case (viii)) (Figure 7). The relocation to the met-office 1956 also did not impact on Tmin.
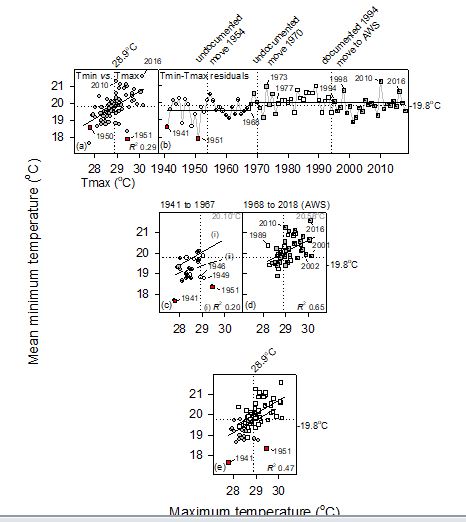
Figure 7. Despite three known and several undocumented site changes, a single step-change is detected in Tmin-Tmax residuals in 1968 (b). Free-fit regression lines in (c) show outliers in 1941 and 1951 skew the regression relative to that when they are ignored (i) resulting in regression (ii) being not significant (P = 0.21). Multiple linear regression of the step-change with Tmax shows lines are statistically parallel but as R2adj = 47% much variation is unexplained. Influence plots show data for 1949, 1972, 1989, 2001, 2010 and 2016 are influential (by Cooks distance) and out of range but were not ignored.
Segmented analysis shows that as trend before and after 1968 is not significant, the step-change model is more appropriate than a naïve trend model (Table 2). Case (vii) residuals are normally distributed, independent and homoscedastic and there is no residual trend or unaccounted-for signal in the time-domain. All the warming in Tmin data is therefore due to the step-change not the climate.
Table 2. As Tmin data consist of untrending segments joined by a step-change in 1969, the overall trend of 0.16oC/decade is spurious.
| Tmin segment | Raw data trend | P |
| Overall | 0.162oC/decade | P <0.001; R2adj 0.287 |
| 1941 to 1967 | -0.158oC/decade | ns |
| 1968 to 2018 | 0.088oC/decade | ns |
4. Discussion
Although detected changepoints in temperature data are optimised and verified using independent statistical methods, three issues are unresolved: (i), the timing of the move from near the original Aeradio office to the radiosonde site and the exact location of that screen in relation to the met-office; (ii), the cause of Tmin step-change in 1968; and, (iii), whether the up-step in 2015 is likely to become significant in the future.
There is evidence of a met-enclosure east of the new met-office in 1952; however, there is also a path and another enclosure south of the Aerado office (Figure 3). The instrument file mentions a radiosonde hut (Hut 16A on RAAF drawing 51/52/42A) existing in 1953 (p. 201) but the drawing is unavailable. As there were no buildings immediately north of the met-office in 1952 or west of the runway before 1955, the only obvious candidate is the isolated building on a raised pad between the met-office and the previous Aeradio site referenced ‘as’ in the Figure. The distinct step-down in Tmax in 1954 is consistent with the site moving to a cooler location. Whatever happened afterwards in the vicinity of the met-office (including moving the screen after Cyclone Agnes in 1956 and extending the office before 1969) was not influential on Tmax.
Tmin increased abruptly and permanently in 1968 and aerial photographs show extensions to the eastern end of the office cast shade towards the enclosure in the late afternoon (Figure 8), which is the probable cause of the upstep. Changes before 1968, the move in 1970 and subsequently were not influential. Data thus consist of two untrending segments joined by a single site-related discontinuity.
On-going changes in the vicinity of the weather station indicated by time-lapse Google Earth Pro satellite images (15 July 2009 to 13 October 2017) include that herbicide is used irregularly to control vegetation (the site and its surrounds are generally bare of groundcover) and that earthworks commenced for the construction of a building and car park west of the site in May 2017. The building was completed by 26 July and occupied before 13 October. Hardstanding associated with another smaller development completed before 18 July 2017 is just 17 metres west of the Stevenson screen.
The site changed dramatically in a short space of time (Figure 9). Reducing transpiration by vegetation in the vicinity of the Stevenson screen also reduces the potential for cooling via the water cycle and increases advection of sensible heat to the local atmosphere, which in-turn increases Tmax (or causes spikes or over-ranging by electronic AWS probes). Also, heat stored in buildings and hardstanding areas such as car parks during the day is advected to the local atmosphere at night, which increases Tmin. Changes are irreversible; the site is warmer and likely to remain warmer irrespective of the climate.
5. Conclusions
Townsville’s temperature datasets are dominated by poorly catalogued site and instrument changes and with those correctively identified and verified there are no residual signals indicating the climate has changed or warmed. There is therefore no likelihood of adverse climate-related consequences on Barrier Reef ecosystems.

Figure 8. Aerial photographs show the met-office was extended between July 1965 and June 1969. A memo in the Garbutt instrument file (p. 70; 29 October 1969) notes that extensions to the building “restricts the sun reaching the (sunshine recorder and actinograph) from 5 pm”.

Figure 9. Google Earth Pro satellite images show developments in the vicinity of the Townsville airport met-enclosure are permanent and likely to impact on temperature measurements. Google Earth Pro measurement tools show hardstand areas to the west of the site are within 17 m of the Stevenson screen.
Author’s note: Although this draft paper has been carefully researched and uses statistical tools, data and other evidence that is available in the public domain, the Author accepts no responsibility for errors of fact arising from the scarcity of information or photographs etc. whose interpretation is difficult.
Dr Bill Johnston (Draft version: 31 January 2019.)
Appendix 1. Dataset used in the study
Count Median Average MaxAv Average MinAv
78 1069.65 28.91534821 19.82316846
Year Rain RainLag1 MaxAv MaxN MaxVar MinAv MinN MinVar
1941 1964.1 1798 27.78109589 365 6.111207587 17.67506849 365 33.93764594
1942 1117.4 1964.1 28.84438356 365 6.553244468 19.55 360 17.75331476
1943 913.1 1117.4 28.77671233 365 8.201901249 20.02109589 365 18.34337242
1944 1128.5 913.1 28.04344262 366 8.117915787 19.19315068 365 20.85629911
1945 1034.4 1128.5 28.32093664 363 6.817626745 19.75906593 364 16.90716276
1946 1344.7 1034.4 28.93726027 365 8.438772693 18.82417582 364 26.23528169
1947 1402.8 1344.7 28.81404959 363 8.394636318 20.07 360 15.97057382
1948 633.1 1402.8 28.65824176 364 8.395772107 19.67978142 366 20.02791886
1949 1312.2 633.1 29.09972527 364 8.351542624 18.7478022 364 29.49947174
1950 2195.9 1312.2 28.47972603 365 8.36255487 18.9369863 365 19.73876562
1951 1042.3 2195.9 29.45287671 365 7.484586482 18.35917808 365 21.98676306
1952 923.5 1042.3 29.06593407 364 8.082582872 19.85384615 364 22.87202373
1953 1800.7 923.5 28.30438356 365 7.499211501 18.94725275 364 25.37390428
1954 1503.4 1800.7 27.90494505 364 6.810278509 19.29340659 364 17.46425393
1955 1561.1 1503.4 28.02630137 365 8.095350294 19.74410959 365 16.47521933
1956 2029.1 1561.1 27.96428571 364 9.937178276 19.32231405 363 21.20008082
1957 737.8 2029.1 28.48767123 365 6.696633298 19.18712329 365 16.8493667
1958 1422.7 737.8 28.83763736 364 7.338001014 19.64849315 365 17.11530679
1959 1242.5 1422.7 28.2862259 363 7.692295938 19.00493151 365 23.19327232
1960 1366.9 1242.5 28.13142077 366 7.07361277 18.63661202 366 24.14320383
1961 596.8 1366.9 28.50137363 364 6.495122075 18.75643836 365 22.62861915
1962 879.6 596.8 28.85796703 364 6.872525883 19.67835616 365 19.98142586
1963 1068.9 879.6 28.37651934 362 7.07875461 18.86997245 363 24.49216215
1964 1259.7 1068.9 28.85874317 366 7.310484991 20.08956044 364 17.97190173
1965 1032.7 1259.7 28.28109589 365 6.187031763 18.78159341 364 18.7968228
1966 532 1032.7 28.57753425 365 5.974164233 19.21780822 365 16.48817101
1967 766.8 532 28.40876712 365 8.572505344 19.24230769 364 19.13539521
1968 1482.8 766.8 28.42103825 366 8.186816453 19.51830601 366 19.63629411
1969 464.2 1482.8 28.97123288 365 8.075131718 20.56054795 365 16.73382387
1970 722.5 464.2 29.00520548 365 8.479066235 20.09862637 364 20.38129287
1971 1106.4 722.5 29.18109589 365 12.04538341 19.90357143 364 23.06012495
1972 1090.4 1106.4 28.62739726 365 7.752049526 18.89453552 366 23.60479198
1973 1531.3 1090.4 29.1430137 365 4.620205178 21.08383562 365 13.46778745
1974 1705.7 1531.3 28.5169863 365 7.472567816 19.5690411 365 24.16186858
1975 1447.5 1705.7 28.58054795 365 5.578164534 20.21452055 365 15.89327759
1976 1437.1 1447.5 28.97568306 366 8.613955012 19.39146006 363 30.60045173
1977 1319.8 1437.1 28.28027397 365 8.441752672 19.4290411 365 24.53360485
1978 1070.4 1319.8 28.62383562 365 8.995281951 19.86648352 364 20.80476887
1979 1025 1070.4 28.73452055 365 8.316167695 19.95111111 360 21.46434417
1980 721.8 1025 29.12213115 366 7.122056816 20.16857923 366 20.52172236
1981 1761.6 721.8 28.73342466 365 8.727121481 20.06153846 364 20.16165713
1982 701 1761.6 28.68109589 365 10.17263616 19.2361516 343 28.17968339
1983 781.8 701 29.10684932 365 10.37333208 20.88054795 365 18.97234036
1984 961.1 781.8 28.73961749 366 7.578343963 20.11967213 366 20.54569414
1985 629.6 961.1 28.78328767 365 11.16337378 20.05123288 365 27.22778007
1986 624 629.6 29.36986301 365 7.70216619 20.93543956 364 17.88036592
1987 767.6 624 29.44246575 365 7.454922475 20.96767123 365 20.50845747
1988 810.6 767.6 29.32650273 366 7.328857325 20.86502732 366 19.23488315
1989 1121.8 810.6 28.20931507 365 10.19771519 20.38575342 365 19.29644483
1990 1668 1121.8 28.67013699 365 13.57655081 19.93972603 365 23.24784058
1991 1530.2 1668 29.07479452 365 6.255351949 19.54520548 365 23.83759371
1992 597.8 1530.2 29.38743169 366 8.334252564 20.46202186 366 22.28954001
1993 496 597.8 28.94465753 365 5.831159566 20.31780822 365 16.12003914
1994 469.6 496 29.20958904 365 9.016253952 19.64767123 365 24.8200289
1995 709.8 469.6 29.38958904 365 9.669561644 20.44356164 365 22.13131146
1996 630.2 709.8 29.74027397 365 7.006258166 20.17021858 366 25.13064488
1997 1496.8 630.2 28.72465753 365 6.849445281 19.55808219 365 21.50908972
1998 1992.2 1496.8 29.40767123 365 6.531094837 21.09452055 365 15.19601385
1999 1076.4 1992.2 29.0969863 365 6.572545838 19.53753425 365 22.06042797
2000 2399.8 1076.4 28.53114754 366 7.304890186 19.46120219 366 22.89476458
2001 467.2 2399.8 30.14164384 365 6.419964323 19.85027473 364 25.68812665
2002 768.6 467.2 29.89561644 365 9.217068644 19.91972603 365 24.46785157
2003 580.4 768.6 30.06986301 365 6.593539816 20.61479452 365 18.29774755
2004 864.8 580.4 29.66420765 366 7.176934576 20.09836066 366 27.10684662
2005 513.6 864.8 29.76054795 365 10.17294475 20.80520548 365 20.18148382
2006 993.8 513.6 28.96164384 365 7.420392895 19.89890411 365 21.34807572
2007 1295.4 993.8 28.88 365 10.54187912 19.91369863 365 24.60953711
2008 1445.2 1295.4 28.96830601 366 8.147376301 19.83169399 366 23.18803383
2009 1989.4 1445.2 29.52849315 365 5.197592503 19.75753425 365 21.04228511
2010 2006.4 1989.4 28.97534247 365 4.815379347 21.26356164 365 13.50858618
2011 1551.4 2006.4 28.63424658 365 7.185060214 19.3939726 365 28.73562291
2012 1314.6 1551.4 28.76174863 366 9.910204057 19.79508197 366 21.8594278
2013 715.2 1314.6 29.6660274 365 7.104776757 20.43205479 365 18.08899714
2014 1037.2 715.2 29.11205479 365 8.358205931 20.22630137 365 21.05782282
2015 397.6 1037.2 30.05123288 365 7.866461388 20.66684932 365 21.59304636
2016 951.4 397.6 30.10081967 366 8.113451381 21.58465753 365 14.50520352
2017 789.6 951.4 29.65384615 364 6.941390125 20.56263736 364 18.95799413
2018 1129 789.6 29.7399449 363 7.990527069 20.17115385 364 22.95511602
Appendix 2. Scenario tests


[1] https://www.coralcoe.org.au/about/the-centre-of-excellence
[4] E.g. http://www.gbrmpa.gov.au/our-work/threats-to-the-reef/climate-change and https://www.barrierreef.org/?gclid=EAIaIQobChMIp4XMrpSw3wIVGyQrCh3uWQfnEAAYASAAEgLXVPD_BwE
[5] R Core Team (2016). R: A language and environment for statistical computing. R Foundation for Statistical Computing, Vienna, Austria. URL https://www.R-project.org/
[6] Search by Barcode at: http://soda.naa.gov.au/barcode/
[7] Aerial photograph print 1132 (24 April 1944) https://nla.gov.au/nla.cat-vn4602228
[8] Aerial photograph print 5005 (1 February 1952) https://nla.gov.au/nla.cat-vn4602275
[9] http://www.bom.gov.au/climate/change/acorn-sat/documents/ACORN-SAT-Station-Catalogue-2012-WEB.pdf
[10] Burnham, K.P, Anderson, D.R and Huyvaert, K.P. 2011. AIC model selection and multimodel inference in behavioral ecology: some background, observations, and comparisons. Behav Ecol Sociobiol 65, 23-35. doi 10.1007/s00265-010-1029-6)
[11] https://cran.r-project.org/web/packages/gvlma/gvlma.pdf
[12] https://cran.r-project.org/web/packages/dplyr/dplyr.pdf