Is homogenisation of Australian temperature data any good?
Part 1. Methods case study: Parafield, South Australia
Dr Bill Johnston
scientist@bomwatch.com.au
Imagine arriving at a crime scene with a toolkit of technical knowhow, where the only evidence of what happened is some maximum temperature data and incomplete notes about where they were observed and conditions that may have affected them.
Time starts NOW …..
Background
Methods used by Bureau of Meteorology (BoM) senior research scientist Dr Blair Trewin, lead author of Working Group I of the IPCC’s 2021 Sixth Assessment report, and a member of the World Meteorological Organisation Expert Team on Climate Monitoring and Assessment, and before him Neville Nicholls, Simon Torok, Paul Della-Marta (and others) and Karl Braganza, are in urgent need of review.
All have published papers in peer-reviewed scientific journals relating to data homogenisation and based on those papers, which are in the public domain, claims have been made repeatedly by The Conversation, the ABC, The Guardian and Fairfax media and even The Australian, and for Braganza, to the 2019/20 Bushfires Royal Commission, that temperature measured at BoM weather stations has increased in recent decades due to anthropogenic emissions of CO2.
Maximum temperature (Tmax) varies up and down depending on how much net energy is convected away as latent heat via evaporation from plants, soil and surfaces (collectively referred to as evapotranspiration). As evapotranspiration at dryland sites cannot exceed the rainfall, latent heat loss equals 2.26 MJ/kg of water evaporated, equivalent to is 2.26 MJ/mm of rainfall received.
Evapotranspiration of average rainfall at Parafield (443 mm) for example, would remove 1001.2 MJ of energy (443mm times 2.26 MJ), which is 15.7% of average total solar exposure of 6345 MJ/yr. The balance, not accounted for by evapotranspiration heats the air in contact with the ground, and it is that portion of the local heat balance that is measured during the heat of the day by Tmax thermometers held 1.2m above the ground in Stevenson screens (Figure 1). It follows that for any weather station, dry years are warm and the drier it is the warmer it gets.
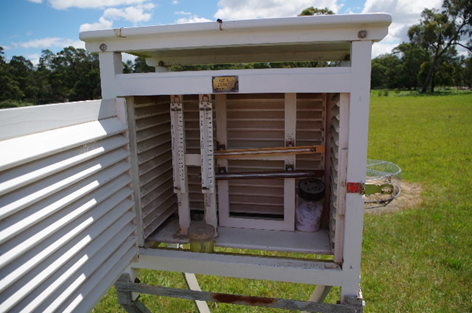
Figure 1. Maximum and minimum thermometers held horizontally; and dry and wet-bulb thermometers held vertically in the well-maintained 60-litre Stevenson screen at Cranbourne Botanic Gardens, Melbourne.
The First Law Theorem, that available energy is expended via latent and sensible heat pathways, provides a physical reference frame for evaluating the quality of weather station data based on the relationship between Tmax and rainfall, which should be linear and negative. The proportion variation explained by rainfall, known as the coefficient of determination (R2 or more exactly R2 adjusted for the number of terms in the model (R2adj)) provides a measure of the quality of Tmax data (Figure 2). Watering, deterioration of equipment and lackadaisical practices reduce the goodness of fit (R2adj <0.05 or 50% of variation explained), while for an excellent site it may be as high or higher than 0.7 (>70%).
The first tool in the toolbox, naïve linear regression of the form average Tmax ~ annual rainfall, investigates the fitness of Tmax data using rainfall as the comparator or control variable. The coefficient (Tmax/100mm of rainfall), its sign (+ or ‑), significance (P level) and variation explained (R2adj) assist diagnosis of the dataset.
Read on …
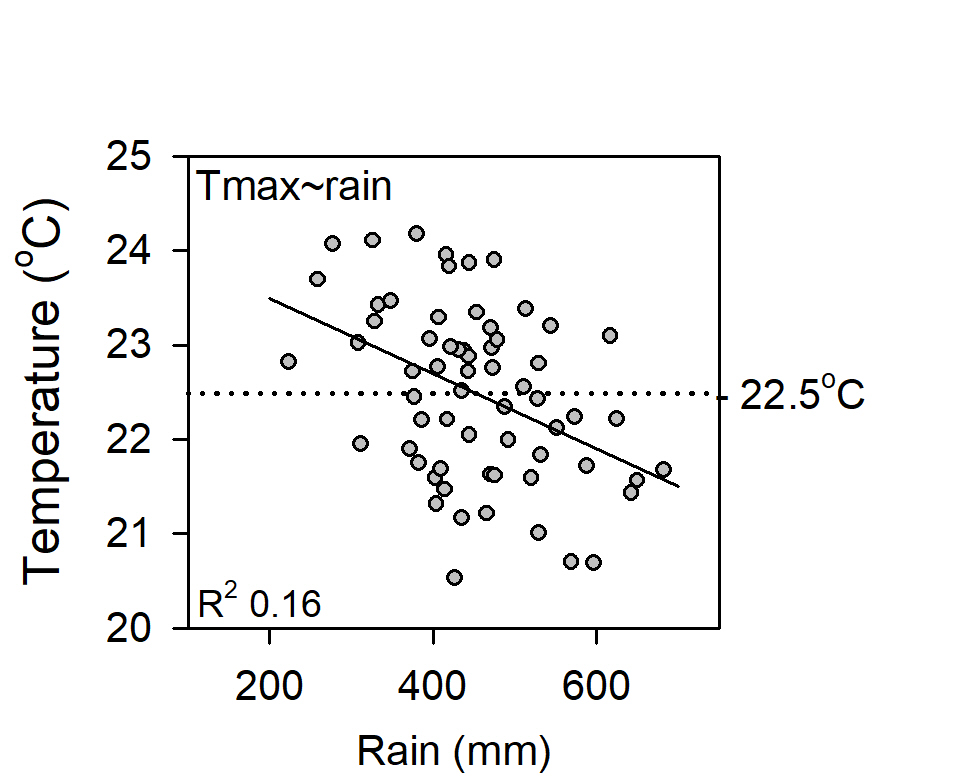
Figure 2. The naïve relationship between average Tmax and annual rainfall at Parafield. Although the slope is negative and highly significant (P <0.001), only 16% (R2adj = 0.16) of variation is explained.
The line in Figure 2 only explains the rainfall portion of the Tmax signal and so while rainfall reduces Tmax ‑0.04oC/100mm and the coefficient is highly significant (the P level is less than 0.001), only 16% of variation is explained, thus, the relationship is very imprecise. So, what of the unexplained variation – the residual non-rainfall portion of the signal?
Calculated as the difference between the line (the equation), and each Tmax data-point, most statistical packages provide a table of residuals, which may be positive or negative. However, programs like Excel require them to be calculated manually (there are examples on the internet).
Independent statistical methods are used to examines Tmax ~ rainfall residuals – that part of the signal not related to rainfall, which if all variation is explained, should be random and free of systematic effects.
Read on …
Residuals from naïve regression are usually small, zero-centred numbers. Adding the dataset grand-mean to each value reconstitutes the original scale without changing their relativity or other properties. Except that the points in Figure 3 appear random, the Figure provides little additional information. However, while the data seem sound, low precision suggests a variable may be missing.
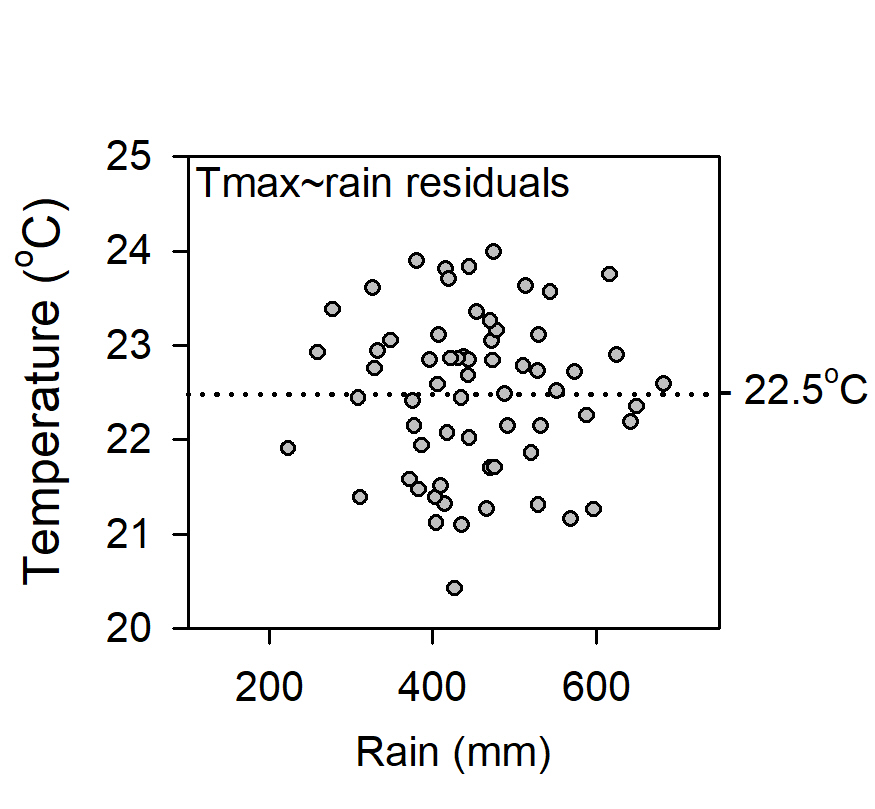
Figure 3. Rescaled residuals from the Tmax ~ rainfall relationship in Figure 2.
Linear regression partitions the original dataset into the portion of the Tmax signal attributable to rainfall, which is the physically deterministic covariable described by the linear fit in Figure 2, and variation that is independent of rainfall, which are the re-scaled residuals in Figure 3.
Next, the rescaled residuals in Figure 3 are analysed in the order they were observed and checked for changes that may indicate background, non-rainfall effects (Figure 4).
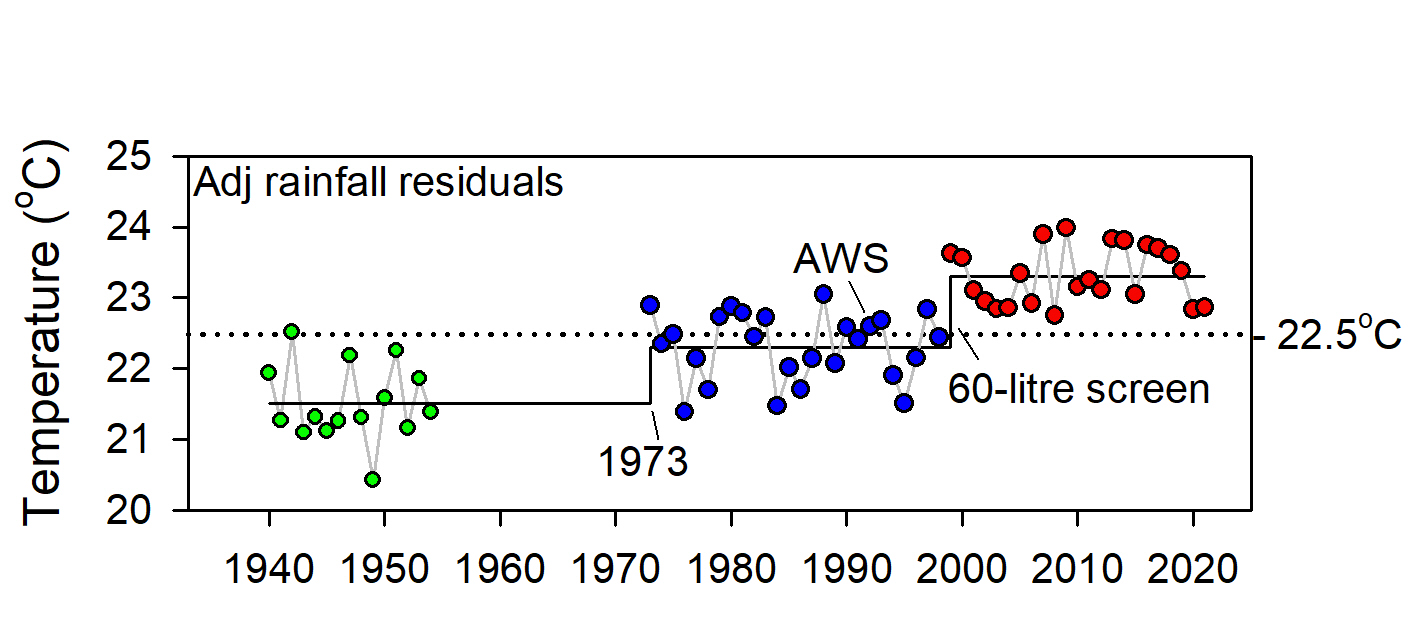
Figure 4. Step-change analysis of re-scaled residuals identified step-changes in 1973 which was caused by a site move before 1968, and another in 1999, probably caused by replacing a former 230-litre Stevenson screen with a more sensitive 60-litre one. (Data from 1955 to 1973 exist, but have not been digitised)
Step-changes Tmax residuals in Figure 4 were highly significant, meaning there was a very low probability they were due to chance. Analysis was undertaken using the Excel 2007 version of Sergi Rodionov’s Sequential Three-step Analysis of Regime Shifts (STARS) v6.3 (ICES Journal of Marine Science, 62: 328e332 (2005) doi:10.1016/j.icesjms.2005.01.013), which is in the public domain (https://sites.google.com/view/regime-shift-test/downloads). While other step-change tools are available (see https:// www.marinedatascience.co/blog/2019/09/28/comparison-of-change-point-detection-methods/), STARS is convenient, reliable and comparable with other methods.
Closing the case. Metadata, archived aerial photographs maps, plans, satellite images etc. are used where possible to confirm step-change scenarios and to find the combination that best fits the data. There is only one optimal outcome, which is that segmented responses to rainfall are the same (segmented regressions are parallel) and that rainfall-adjusted group means are different (segmented regressions are not coincident). While the data stepped up, no evidence was found that the climate had changed or warmed.
The BomWatch approach is objective, robust and replicable and does not involve data manipulation. It is also amenable to batch-processing of paired Tmax-rainfall datasets in the Bureau of Meteorology’s database, which would put to rest the hype about climate change and warming once-and-for-all.
Read on …
Bias in the BoM’s homogenisation methods
Comparative homogenisation methods used by the Bureau are highly questionable. Problems include:
- Use of faulty and unreliable metadata for specifying/verifying changepoints in target site data (data to be homogenised);
- First-differenced linear correlation with the target-site data, selects comparators that likely embed parallel faults;
- Overly complicated methods lack transparent checks and balances that provide confidence that their methods are trustworthy.
Data for Parafield airport (Bureau ID 23013) commence on 1 April 1939 but site-summary metadata does not provide coordinates for the site. Google Earth Pro shows the current Almos automatic weather station (AWS) is near the centre of the airport about 1 km south of the control tower at Latitude ‑4.7977, Longitude 138.6281. While data show a naïve trend of 0.31oC/decade (3.1oC/century) a gap in available data from 1955 to 1973 is unexplained. Due to step-changes before 1973 and in 1999, data are not homogeneous, nevertheless, together with other sites, Parafield was used to homogenise ACORN-SAT sites at Oodnadatta, Tarcoola, Woomera, Ceduna, Kyancutta, Port Lincoln, Nuriootpa, Adelaide (Kent Town) and Robe in 2011 (Figure 5).
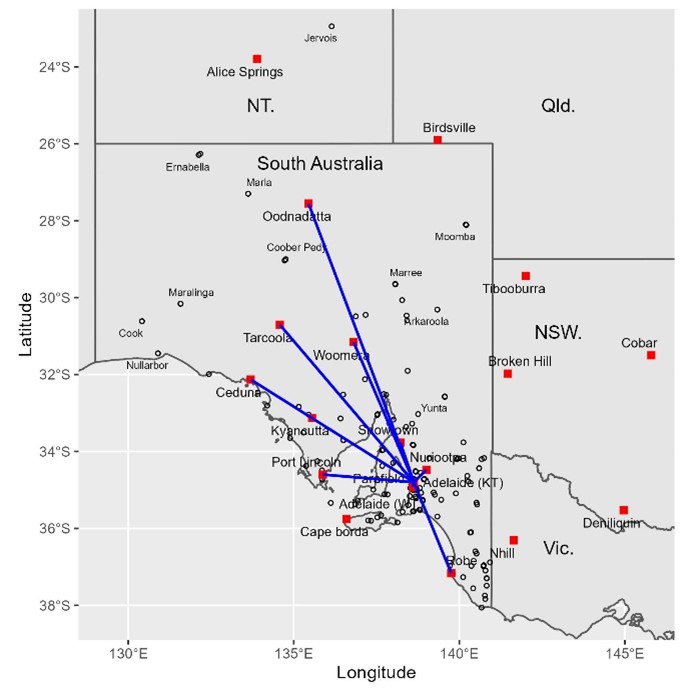
Figure 5. The first (2011) iteration of ACORN-SAT used data for Parafield Airport, 15 km west of Adelaide, with other cross-correlated sites to homogenise ACORN-SAT sites at Oodnadatta (859 km distant), Tarcoola, Woomera, Ceduna (546 km), Kyancutta, Port Lincoln, Nuriootpa, Adelaide (Kent Town) and Robe. ACORN-SAT sites are indicated by red squares. Weather stations in South Australia having >20 years of data are indicated by open circles, some of which are named.
In contrast to Acorn-Sat v.1, the 2021 iteration (v2.2) used Parafield with other cross-correlated sites to only adjust Adelaide (Kent Town), Cape Borda, Port Lincoln, Robe, Kyancutta, Nhill and Ceduna (Figure 6). So, something in the method caused Parafield to be used for some sites in 2011, but not the same sites in 2021. Illustrating the complexity of the Bureau’s methods, radar graphs show location of the 24 sites used to homogenise Ceduna in 2021 and the 30 sites used for Oodnadatta. (The great circle distance from Oodnadatta to Deniliquin airports is 1263 km and to Cobar 1096 km.)
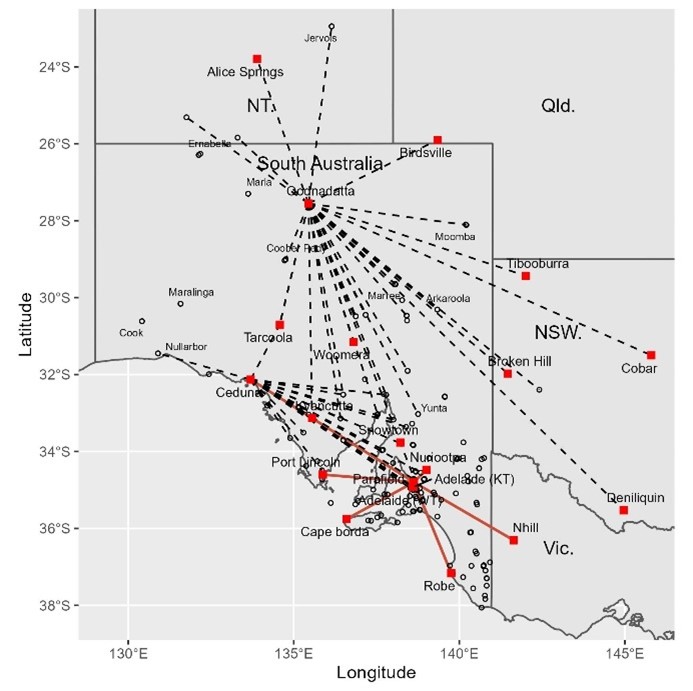
Figure 6. ACORN-SAT v.2 used Parafield airport data with other cross-correlated sites, to only homogenise ACORN-SAT sites at Adelaide (Kent Town), Cape Borda, Port Lincoln, Robe, Kyancutta, Nhill and Ceduna, which is a geographically less-dispersed suite compared to v.1. The radar plots locate the of 24 sites in total, used to homogenise ACORN-SAT data for Ceduna and the 30 sites used for Oodnadatta.
Homogenisation of Australia’s temperature record underpins the Australian government’s decarbonisation agenda including upheavals in energy supply networks, rapid increases in energy costs that will force energy-intensive industries offshore, and the destruction of habitats and despoiling of landscapes by wind turbines, solar panels and woody-weeds.
While true costs have not been revealed, the impact on future generations will be at a scale never envisaged by those advocating for change. While elites will accumulate wealth and power, those agitating on their behalf for climate justice and other paradoxical causes are laying the foundations for their own highly indebted, personally limiting Orwellian future. Without abundant, reliable, affordable energy and exports of minerals, coal and agricultural commodities to support orderly market-based transitions, including to nuclear power, Australia risks becoming a voiceless, crippled, heavily manipulated society devoid of a productive base.
Conclusions
- The Bureau’s homogenisation methods lack rigor, replicability and quality control and are likely to result in trends that have nothing to do with the climate. Selection of comparator neighbouring datasets on the basis of first-differenced correlations axiomatically identifies those with parallel faults.
- Use of reference series composed of data that are not homogeneous to detect and adjust changes in ACORN-SAT data has no scientific or statistical merit and should be abandoned.
An important link – find out more
The page you have just read is the basic cover story for the full paper. If you are stimulated to find out more, please link through to the full paper – a scientific Report in downloadable pdf format. This Report contains far more detail including photographs, diagrams, graphs and data and will make compelling reading for those truly interested in the issue.
Click here to download the full paper including, photos and tables of data
Note: Line numbers are provided in the linked Report for the convenience of fact checkers and others wishing to provide comment. If these comments are of a highly technical nature, relating to precise Bomwatch protocols and statistical procedures, it is requested that you email Dr Bill Johnston directly at scientist@bomwatch.com.au referring to the line number relevant to your comment.
Dr Bill Johnston
25 November 2022
Note: Line numbers are provided in the linked Report for the convenience of fact checkers and others wishing to provide comment. If these comments are of a highly technical nature, relating to precise Bomwatch protocols and statistical procedures, it is requested that you email Dr Bill Johnston directly at scientist@bomwatch.com.au referring to the line number relevant to your comment.