Tennant Creek NT [BoM ID 015135 (airport), 015087 (post office); joined 1 November 1970] Temperature data from February 1910 to December 2022.
Is homogenisation of Australian temperature data any good?
Dr Bill Johnston, former research scientist, NSW Department of Natural Resources
www.bomwatch.com.au
Protocols, which are essentially a description of the research question (hypothesis) and the means by which it would be addressed, lie at the heart of the scientific method. This report outlines the basis for, and steps involved in undertaking unbiased analysis of trend and change in Australian maximum temperature (Tmax) datasets using Tennant Creek as the case study.
Based on the First Law of Thermodynamics, BomWatch protocols are transparent, objective and replicable and provide a firm baseis for assessing trend and change in maximum temperature datasets and for resolving issues related to the Bureau of Meteorology’s homogenisation of the same data.
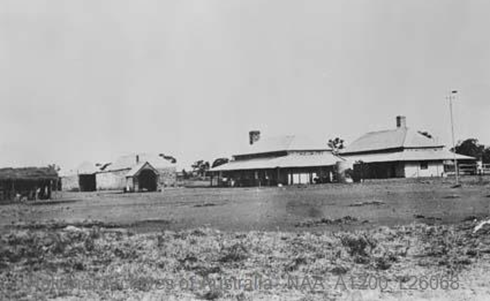
The Tennant Creek Telegraph station in 1872, showing a wind vane and Stevenson screen on the far right of the photograph (National Archives of Australia Item ID: 11774998). As the site was close to buildings, it was probably watered by bucket or watering-can during the seasonal ‘dry’.
Summary
The case study concluded that step-changes related to site changes caused Tmax to increase 1.51oC between 1910 and 2022 independently of rainfall, and that site-changes and rainfall simultaneously explained 73.8% of Tmax variation. Post hoc analysis found no residual trend or change was attributable to any other factor including CO2, coalmining, electricity generation or anything else.
Homogenisation cooled pre-1935 and pre-1963 Tmax to varying extents and achieved trends approaching 0.15oC/decade. Australian Climate Observations Reference Network – Surface Air Temperature V.2.4 also adjusted data higher from 1999 to 2015 by 0.52oC thereby smoothing the effect of post-2013 site changes so they appeared to be due to the climate. However, while trend became more significant and goodness-of-fit improved, variation in Tmax explained by rainfall declined from 46.3% initially, to 16.5% for ACORN-SATv.2.4.
Maps, plans, aerial photographs and satellite images show unequivocally that trend in Tmax data was mostly due to spraying out the grass and replacing the former 230-litre Stevenson screen in 2012, and installing a wind-profiler array within 45m of the screen before March 2013.
Bomwatch protocols
BomWatch protocols comprise four elements, namely:
· The overall relationship between Tmax and rainfall partitions total variation into that due to rainfall, and the residual non-rainfall part. Linear regression also derives the overall Tmax/rainfall coefficient, and significance (P) and goodness of fit (R2adj) statistics that indicate conformity with the First Law of Thermodynamics.
· Homogeneity analysis of rescaled residuals identifies non-climate impacts on data, which are categorised as step-change or (Sh)ift scenarios
· Segment-by-segment analysis with rainfall detects outliers, lack of fit, and other potential problems, and,
· Categorical multiple linear regression (and interaction analysis) finalises and verifies outcomes.
Segmented trend and graphical analysis confirm and verify that relationships are linear, residuals are normally distributed, independent, with constant variance, and that they are timewise homogeneous.
Based on the First Law Theorem that maximum temperature depends on rainfall, BomWatch protocols provide an unequivocable basis for understanding the effect of non-climate impacts on data, and for objectively assessing the BoM’s homogenisation methods.
Click here to download the full paper with photos, graphs and data
Bill Johnston
6 February 2024