Category Archives: Temperature trend

2. Marble Bar, WA

Is homogenisation of Australian temperature data any good?

Part 2. Marble Bar, the warmest place in Australia

Dr Bill Johnston[1]

scientist@bomwatch.com.au

Maximum temperature data for Marble Bar exemplifies all that is wrong with the Australian Climate Observations Reference Network – Surface Air Temperature (ACORN-SAT) dataset used to depict Australia’s warming. Subjective adjustments based on faulty metadata and highly correlated comparator sites that likely embed parallel faults results in trends in homogenised data that are unrelated to the climate.        

Read on … 

Background

Located 150 km southeast of Port Hedland on the edge of the Great Sandy Desert, Marble Bar is reputed to be the warmest place in Australia. The dry season from April to November is extremely dry, while during the ‘wet’, potential evaporation exceeds rainfall even in the wettest month of February. Nevertheless, irregular cyclonic intrusions from the Timor Sea and eastern Indian Ocean can wreak havoc across the Pilbara including at Marble Bar.

Temperature and rainfall have been measured at several locations under a variety of conditions by post office staff and volunteers since 1901. However, due to its isolation the weather station was rarely inspected by the Bureau of Meteorology (BoM), consequently metadata (data about the data) is unreliable. What was it like ‘doing the met’ under blistering hot conditions and how did equipment including thermometers fare with furnace-like winds, desert dust, and at the other extreme, cold winter nights? Typical of an arid swath of northwestern Australia, Marble Bar is an Australian Climate Observations Reference Network – Surface Air Temperature (ACORN-SAT) dataset used to calculate Australia’s warming (Figure 1).

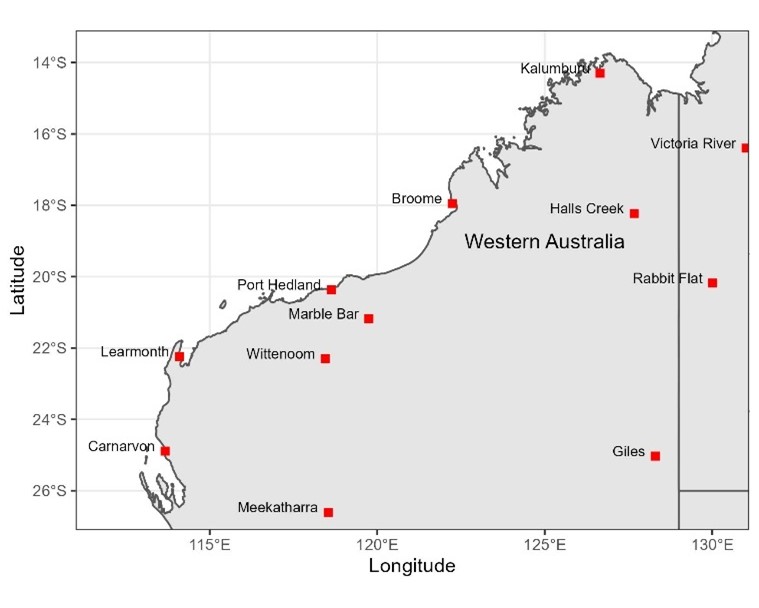
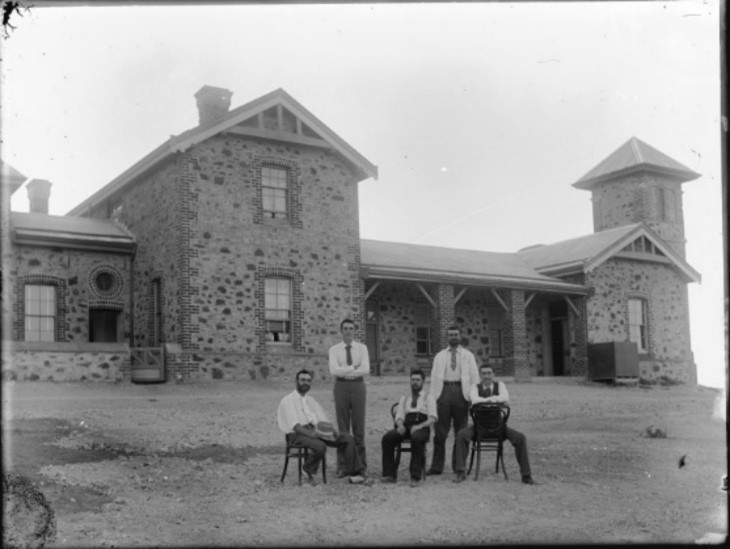
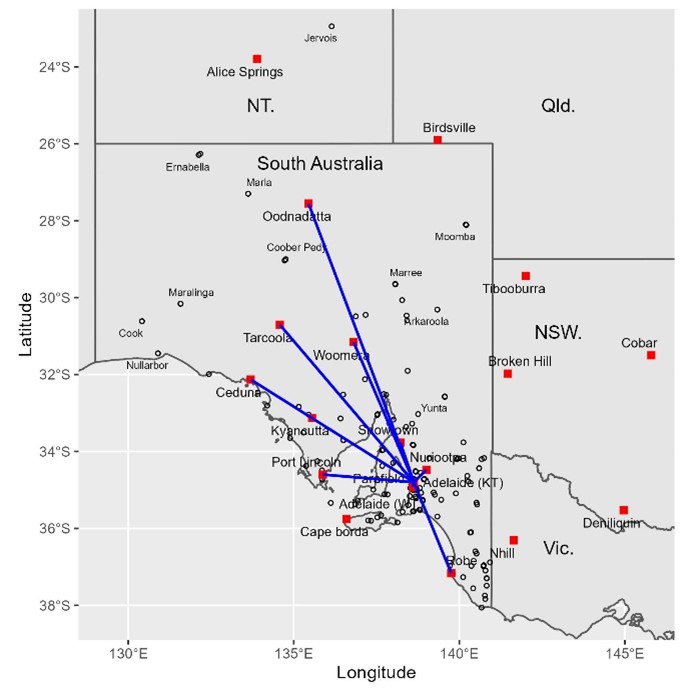
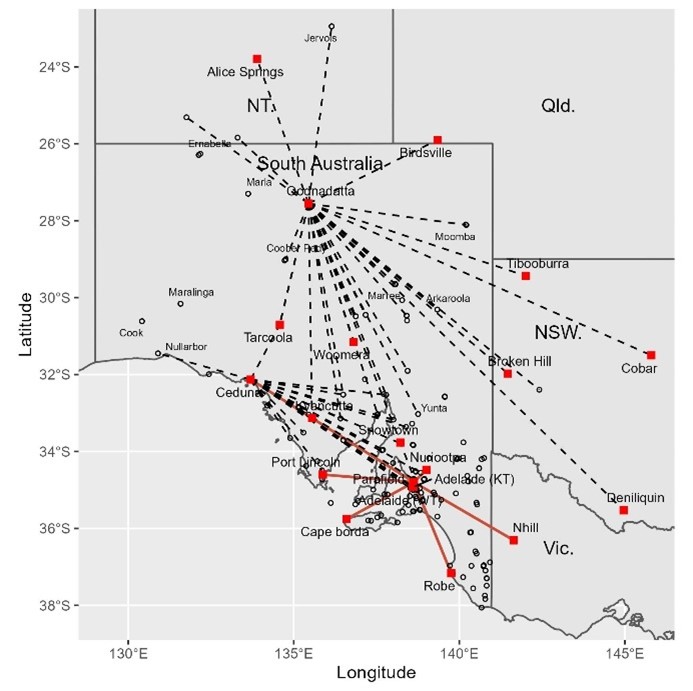
Figure 1. Marble Bar in relation to other ACORN-SAT sites in northwestern Australia (left), and below, staff outside the original post office in 1900, which was built of local stone (State Library WA).

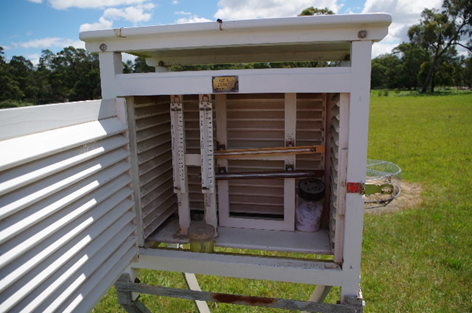
ACORN-SAT metadata failed to mention that a Stevenson screen was originally supplied in 1911 and that the site moved to the new post office on the corner of Francis and Contest streets in 1948 (Figure 2). Also, that the post office was extended in 1961 to accommodate the telephone line exchange which probably required the Stevenson screen to move up-hill towards the shady watered yard behind the residence. It seems the post office closed in 1984 and its functions including weather observations transferred to the general store opposite the Ironclad Hotel (now licenced post office) 230m east. Later, in 1988 the site allegedly moved east, probably to the Roadhouse, from where it relocated to its current position 100m southwest in 1997. 

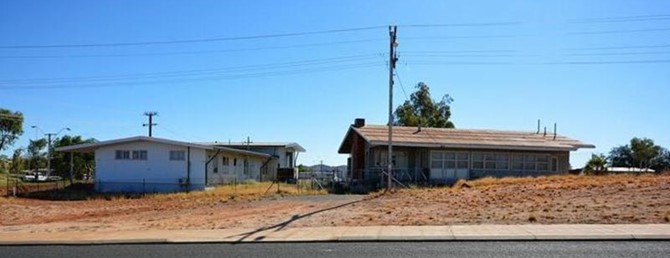
Figure 2. The side-view of the 1948 post office facing Francis Street (left) photographed in 2016 with the 1961 telephone line exchange annex distant from the camera, and the former residence facing Contest Street (realestate.com.au online sales brochure). Original plans show a path between the residence and the rear of the post office and several out-buildings behind including fuel store, generator/battery shed, and garage.

Objective detection of changes in data using robust statistical methods and post hoc attribution is more reliable than using ACORN-SAT and site summary metadata which is often inaccurate and incomplete. Although now restored, by 1945 the original government offices incorporating the post office had been damaged by cyclones and was riddled with termites. Planned for in 1944, the new post office shown in Figure 2 was not opened until August 1948.

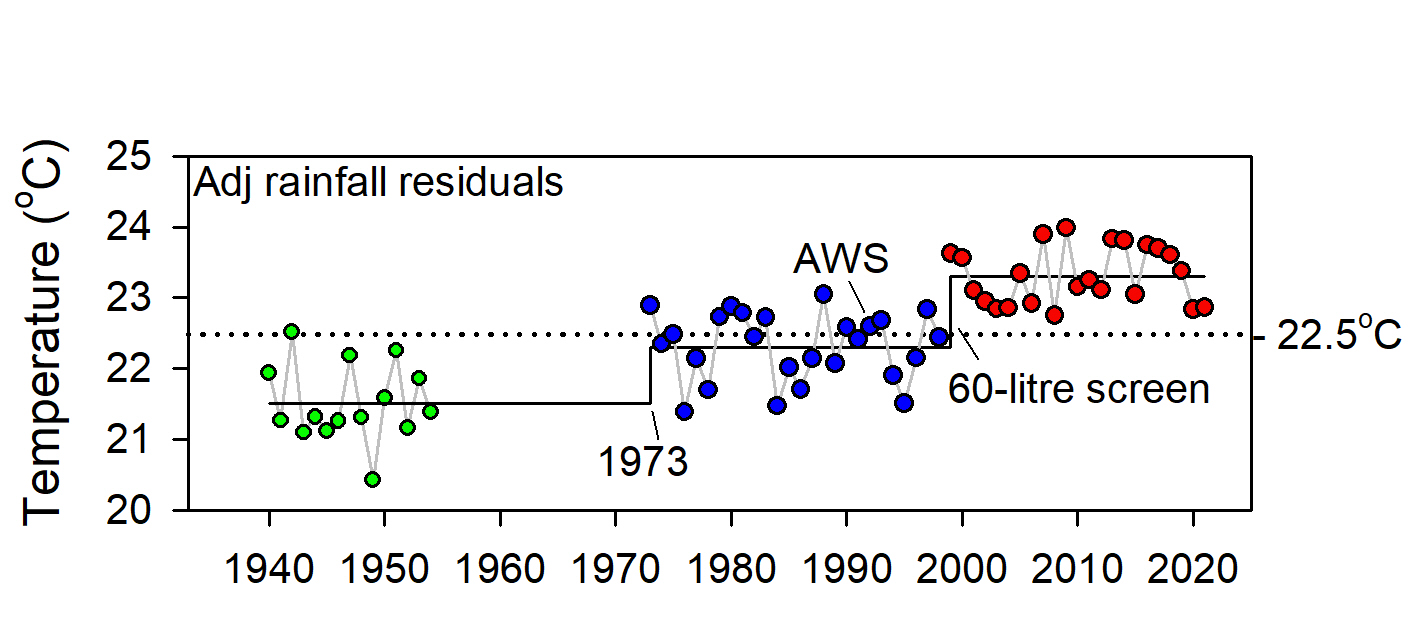
A down-step in Tmax data in 1945, which ACORN-SAT interpreted as site move appeared to be due to observers consistently rounding observations down to the nearest wholeoF, which after converting to Celsius effectively reduced average rainfall-adjusted Tmax by about 0.5oC. While rounding ceased in 1960, data remained cooler than previously until 1988, when it was said the site had become overgrown and was moved “1 km to a residence”. Within that time the Stevenson screen moved clear of the 1961 telephone line exchange, which affected the frequency of high vs low extremes; observations were metricated from 1 September 1972, which affected precision; and in 1984 the site moved to the general store (the current licenced post office), where whole and ½oC were over-reported from 1995 to 1997. It was only after the site relocated in 1998 that data were reasonably consistently observed to the nearest decimal place.

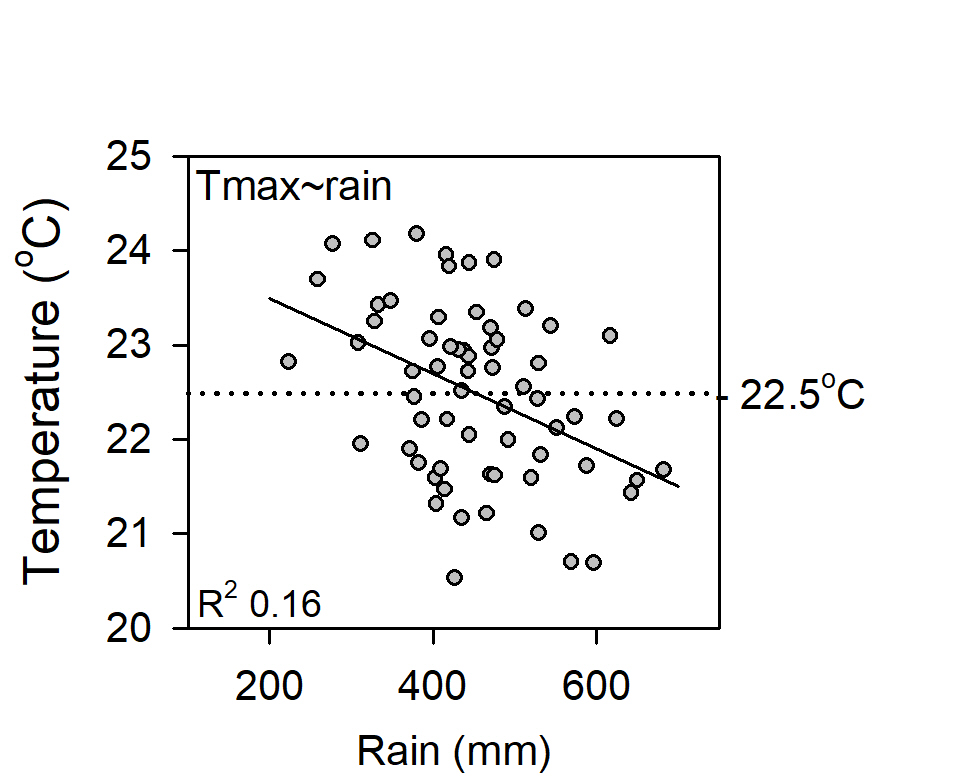
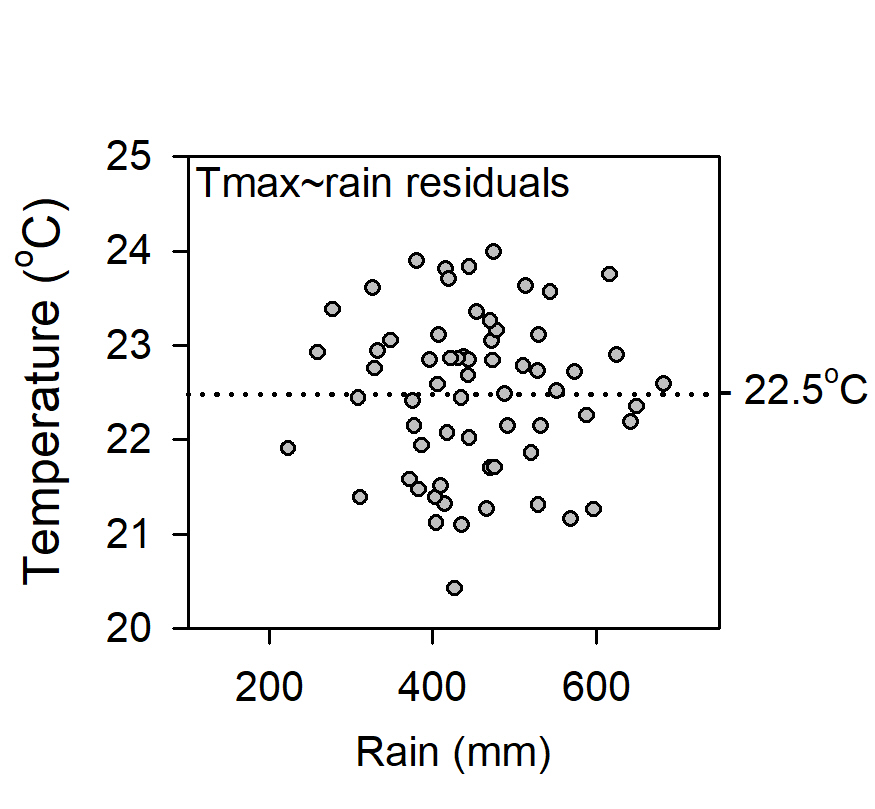
Lack of precision (low R2adj) in the relationship between Tmax, rainfall and site changes, indicates the quality of Marble Bar data is relatively poor. While site changes caused Tmax data to warm 0.9oC since 1901, no warming is attributable to the climate.

Homogenisation

The Bureau’s homogenisation methods are plagued by faulty metadata and the biased selection of neighbouring sites used to make adjustments.       

Read on …   

The most obvious problems with the Bureau’s temperature homogenisation methods are:

  • Metadata for weather stations including Marble Bar is either misleading, scant or non-existent.
  • As no weather stations have stayed the same, it is highly likely within regions that many had undergone concurrent changes/upgrades since they were first established. Examples include post-WWII changes at aerodromes in the late 1940s, installing telephone line exchanges at post offices in the 1950s, metrication in 1972, installation of the major trunk network microwave towers in post office yards by Telecom by 1975, the staged introduction of 60-litre Stevenson screens, automatic weather stations etc.     
  • As many weather stations are affected by synchronous changes and all exhibit similar seasonal cycles, selection of comparator datasets from the pool of possible contenders on the basis of linear correlation of first differences is bound to rank those having parallel faults as candidates for making ACORN-SAT adjustments.

Using faulty metadata to subjectively determine times when something changed, allows changepoints to be manipulated to achieve pre-determined trends. It also discourages further investigation of their cause. For instance, the 1944/1945 down-step at Marble Bar was due to a precision problem not a site move. Other changes included that from 1966 to 1985 the frequency of daily observations greater than 95th day-of-year percentiles was significantly depressed, probably due to watering or shade. Reconstructing what actually happened based on effects observed in data requires changepoints to be identified statistically using robust, statistical methods and post hoc investigation of causes.

Using Pearsons linear correlation to select up to 40 neighbouring sites for constructing comparative reference series is biased. As monthly averages cool from summer to winter and warm from winter to summer, residual cycles in first-differenced data inflate significances of correlations. Thus, from the pool of potential neighbours whose data are not homogeneous, linear correlation is likely to select those having parallel faults. Furthermore, increasing the number of comparators cannot overcome the high likelihood that station changes within regions are somewhat synchronised. 

Objective, replicable homogenisation would investigate time-related changes in properties of datasets using objective statistical tests (of which there are a number) and relate changes in the data to what is known about the site post hoc. For example, by comparing detected changepoints with BoM metadata, documents, maps, plans and aerial photographs held by the National Archives and the National Library of Australia, state authorities, museums, historical societies, newspaper reports etc. Even if supporting information is not available, statistical detection based on the probability of an abrupt sustained change against the NULL hypothesis of no change should be sufficient evidence that change occurred.

Historic data were not collected to be used decades in the future to detect trend and change. Due to inaccurate metadata, poor site control (screen and instrument deterioration, watering, shade), and prior to metrication on 1 September 1972, lack of precision by observers, Marble Bar data could not be regarded as high-quality. As the Bureau’s homogenisation methods are deeply flawed the ACORN-SAT project should be abandoned.

Two important links – find out more

First Link: The page you have just read is the basic cover story for the full paper. If you are stimulated to find out more, please link through to the full paper – a scientific Report in downloadable pdf format. This Report contains far more detail including photographs, diagrams, graphs and data and will make compelling reading for those truly interested in the issue.

Click here to download the full paper with photos graphs and data.

Second Link: This link will take you to a downloadable Excel spreadsheet containing a vast number of Marble Bar data points for the years from 1901 to 2020 and which was used in the analysis of the Marble Bar weather records to support the Full Report.

Click here to download the Excel spreadsheet with data points 1901 to 2020

Note: Line numbers are provided in the linked Report for the convenience of fact checkers and others wishing to provide comment. If these comments are of a highly technical nature, relating to precise Bomwatch protocols and statistical procedures, it is requested that you email Dr Bill Johnston directly at scientist@bomwatch.com.au referring to the line number relevant to your comment.   


[1] Former NSW Department of Natural Resources research scientist and weather observer.

1. Methods: Parafield

Is homogenisation of Australian temperature data any good?

Part 1. Methods case study: Parafield, South Australia

Dr Bill Johnston

scientist@bomwatch.com.au

Imagine arriving at a crime scene with a toolkit of technical knowhow, where the only evidence of what happened is some maximum temperature data and incomplete notes about where they were observed and conditions that may have affected them.

Time starts NOW …..

Background

Methods used by Bureau of Meteorology (BoM) senior research scientist Dr Blair Trewin, lead author of Working Group I of the IPCC’s 2021 Sixth Assessment report, and a member of the World Meteorological Organisation Expert Team on Climate Monitoring and Assessment, and before him Neville Nicholls, Simon Torok, Paul Della-Marta (and others) and Karl Braganza, are in urgent need of review. 

All have published papers in peer-reviewed scientific journals relating to data homogenisation and based on those papers, which are in the public domain, claims have been made repeatedly by The Conversation, the ABC, The Guardian and Fairfax media and even The Australian, and for Braganza, to the 2019/20 Bushfires Royal Commission, that temperature measured at BoM weather stations has increased in recent decades due to anthropogenic emissions of CO2.

Maximum temperature (Tmax) varies up and down depending on how much net energy is convected away as latent heat via evaporation from plants, soil and surfaces (collectively referred to as evapotranspiration). As evapotranspiration at dryland sites cannot exceed the rainfall, latent heat loss equals 2.26 MJ/kg of water evaporated, equivalent to is 2.26 MJ/mm of rainfall received.

Evapotranspiration of average rainfall at Parafield (443 mm) for example, would remove 1001.2 MJ of energy (443mm times 2.26 MJ), which is 15.7% of average total solar exposure of 6345 MJ/yr. The balance, not accounted for by evapotranspiration heats the air in contact with the ground, and it is that portion of the local heat balance that is measured during the heat of the day by Tmax thermometers held 1.2m above the ground in Stevenson screens (Figure 1). It follows that for any weather station, dry years are warm and the drier it is the warmer it gets.

Figure 1. Maximum and minimum thermometers held horizontally; and dry and wet-bulb thermometers held vertically in the well-maintained 60-litre Stevenson screen at Cranbourne Botanic Gardens, Melbourne.

The First Law Theorem, that available energy is expended via latent and sensible heat pathways, provides a physical reference frame for evaluating the quality of weather station data based on the relationship between Tmax and rainfall, which should be linear and negative. The proportion variation explained by rainfall, known as the coefficient of determination (R2 or more exactly R2 adjusted for the number of terms in the model (R2adj)) provides a measure of the quality of Tmax data (Figure 2). Watering, deterioration of equipment and lackadaisical practices reduce the goodness of fit (R2adj <0.05 or 50% of variation explained), while for an excellent site it may be as high or higher than 0.7 (>70%).

The first tool in the toolbox, naïve linear regression of the form average Tmax ~ annual rainfall, investigates the fitness of Tmax data using rainfall as the comparator or control variable. The coefficient (Tmax/100mm of rainfall), its sign (+ or ‑), significance (P level) and variation explained (R2adj) assist diagnosis of the dataset.

Read on …   

Figure 2. The naïve relationship between average Tmax and annual rainfall at Parafield. Although the slope is negative and highly significant (P <0.001), only 16% (R2adj = 0.16) of variation is explained.

The line in Figure 2 only explains the rainfall portion of the Tmax signal and so while rainfall reduces Tmax ‑0.04oC/100mm and the coefficient is highly significant (the P level is less than 0.001), only 16% of variation is explained, thus, the relationship is very imprecise. So, what of the unexplained variation – the residual non-rainfall portion of the signal?

Calculated as the difference between the line (the equation), and each Tmax data-point, most statistical packages provide a table of residuals, which may be positive or negative. However, programs like Excel require them to be calculated manually (there are examples on the internet).

Independent statistical methods are used to examines Tmax ~ rainfall residuals – that part of the signal not related to rainfall, which if all variation is explained, should be random and free of systematic effects.

Read on …   

Residuals from naïve regression are usually small, zero-centred numbers. Adding the dataset grand-mean to each value reconstitutes the original scale without changing their relativity or other properties. Except that the points in Figure 3 appear random, the Figure provides little additional information. However, while the data seem sound, low precision suggests a variable may be missing.

Figure 3. Rescaled residuals from the Tmax ~ rainfall relationship in Figure 2.

Linear regression partitions the original dataset into the portion of the Tmax signal attributable to rainfall, which is the physically deterministic covariable described by the linear fit in Figure 2, and variation that is independent of rainfall, which are the re-scaled residuals in Figure 3.

Next, the rescaled residuals in Figure 3 are analysed in the order they were observed and checked for changes that may indicate background, non-rainfall effects (Figure 4).

Figure 4. Step-change analysis of re-scaled residuals identified step-changes in 1973 which was caused by a site move before 1968, and another in 1999, probably caused by replacing a former 230-litre Stevenson screen with a more sensitive 60-litre one. (Data from 1955 to 1973 exist, but have not been digitised)       

Step-changes Tmax residuals in Figure 4 were highly significant, meaning there was a very low probability they were due to chance. Analysis was undertaken using the Excel 2007 version of Sergi Rodionov’s Sequential Three-step Analysis of Regime Shifts (STARS) v6.3 (ICES Journal of Marine Science, 62: 328e332 (2005) doi:10.1016/j.icesjms.2005.01.013), which is in the public domain (https://sites.google.com/view/regime-shift-test/downloads). While other step-change tools are available (see https:// www.marinedatascience.co/blog/2019/09/28/comparison-of-change-point-detection-methods/), STARS is convenient, reliable and comparable with other methods.   

Closing the case. Metadata, archived aerial photographs maps, plans, satellite images etc. are used where possible to confirm step-change scenarios and to find the combination that best fits the data. There is only one optimal outcome, which is that segmented responses to rainfall are the same (segmented regressions are parallel) and that rainfall-adjusted group means are different (segmented regressions are not coincident). While the data stepped up, no evidence was found that the climate had changed or warmed.

The BomWatch approach is objective, robust and replicable and does not involve data manipulation. It is also amenable to batch-processing of paired Tmax-rainfall datasets in the Bureau of Meteorology’s database, which would put to rest the hype about climate change and warming once-and-for-all. 

Read on …   

Bias in the BoM’s homogenisation methods

Comparative homogenisation methods used by the Bureau are highly questionable. Problems include:

  1. Use of faulty and unreliable metadata for specifying/verifying changepoints in target site data (data to be homogenised);
  2. First-differenced linear correlation with the target-site data, selects comparators that likely embed parallel faults;
  3. Overly complicated methods lack transparent checks and balances that provide confidence that their methods are trustworthy.

Data for Parafield airport (Bureau ID 23013) commence on 1 April 1939 but site-summary metadata does not provide coordinates for the site. Google Earth Pro shows the current Almos automatic weather station (AWS) is near the centre of the airport about 1 km south of the control tower at Latitude ‑4.7977, Longitude 138.6281. While data show a naïve trend of 0.31oC/decade (3.1oC/century) a gap in available data from 1955 to 1973 is unexplained. Due to step-changes before 1973 and in 1999, data are not homogeneous, nevertheless, together with other sites, Parafield was used to homogenise ACORN-SAT sites at Oodnadatta, Tarcoola, Woomera, Ceduna, Kyancutta, Port Lincoln, Nuriootpa, Adelaide (Kent Town) and Robe in 2011 (Figure 5).

Figure 5. The first (2011) iteration of ACORN-SAT used data for Parafield Airport, 15 km west of Adelaide, with other cross-correlated sites to homogenise ACORN-SAT sites at Oodnadatta (859 km distant), Tarcoola, Woomera, Ceduna (546 km), Kyancutta, Port Lincoln, Nuriootpa, Adelaide (Kent Town) and Robe. ACORN-SAT sites are indicated by red squares. Weather stations in South Australia having >20 years of data are indicated by open circles, some of which are named.

In contrast to Acorn-Sat v.1, the 2021 iteration (v2.2) used Parafield with other cross-correlated sites to only adjust Adelaide (Kent Town), Cape Borda, Port Lincoln, Robe, Kyancutta, Nhill and Ceduna (Figure 6). So, something in the method caused Parafield to be used for some sites in 2011, but not the same sites in 2021. Illustrating the complexity of the Bureau’s methods, radar graphs show location of the 24 sites used to homogenise Ceduna in 2021 and the 30 sites used for Oodnadatta. (The great circle distance from Oodnadatta to Deniliquin airports is 1263 km and to Cobar 1096 km.)

Figure 6. ACORN-SAT v.2 used Parafield airport data with other cross-correlated sites, to only homogenise ACORN-SAT sites at Adelaide (Kent Town), Cape Borda, Port Lincoln, Robe, Kyancutta, Nhill and Ceduna, which is a geographically less-dispersed suite compared to v.1. The radar plots locate the of 24 sites in total, used to homogenise ACORN-SAT data for Ceduna and the 30 sites used for Oodnadatta.

Homogenisation of Australia’s temperature record underpins the Australian government’s decarbonisation agenda including upheavals in energy supply networks, rapid increases in energy costs that will force energy-intensive industries offshore, and the destruction of habitats and despoiling of landscapes by wind turbines, solar panels and woody-weeds.

While true costs have not been revealed, the impact on future generations will be at a scale never envisaged by those advocating for change. While elites will accumulate wealth and power, those agitating on their behalf for climate justice and other paradoxical causes are laying the foundations for their own highly indebted, personally limiting Orwellian future. Without abundant, reliable, affordable energy and exports of minerals, coal and agricultural commodities to support orderly market-based transitions, including to nuclear power, Australia risks becoming a voiceless, crippled, heavily manipulated society devoid of a productive base.

Conclusions

  • The Bureau’s homogenisation methods lack rigor, replicability and quality control and are likely to result in trends that have nothing to do with the climate. Selection of comparator neighbouring datasets on the basis of first-differenced correlations axiomatically identifies those with parallel faults.
  • Use of reference series composed of data that are not homogeneous to detect and adjust changes in ACORN-SAT data has no scientific or statistical merit and should be abandoned.     

An important link – find out more

The page you have just read is the basic cover story for the full paper. If you are stimulated to find out more, please link through to the full paper – a scientific Report in downloadable pdf format. This Report contains far more detail including photographs, diagrams, graphs and data and will make compelling reading for those truly interested in the issue.

Click here to download the full paper including, photos and tables of data

Note: Line numbers are provided in the linked Report for the convenience of fact checkers and others wishing to provide comment. If these comments are of a highly technical nature, relating to precise Bomwatch protocols and statistical procedures, it is requested that you email Dr Bill Johnston directly at scientist@bomwatch.com.au referring to the line number relevant to your comment.   

Dr Bill Johnston

25 November 2022

Note: Line numbers are provided in the linked Report for the convenience of fact checkers and others wishing to provide comment. If these comments are of a highly technical nature, relating to precise Bomwatch protocols and statistical procedures, it is requested that you email Dr Bill Johnston directly at scientist@bomwatch.com.au referring to the line number relevant to your comment.   

Day/Night temperature spread fails to confirm IPCC prediction

By David Mason-Jones, 

Research by Dr. Lindsay Moore

The work of citizen scientist, Dr. Lindsay Moore, has failed to confirm an important IPCC prediction about what will happen to the spread between maximum and minimum temperatures due to the Enhanced Greenhouse Effect. The IPCC’s position is that this spread will narrow as a result of global warming.

Moore’s work focuses on the remote weather station at Giles in Western Australia and run by Australia’s peak weather monitoring body, the Bureau of Meteorology (BoM).

Why Giles? 

Giles is the most remote weather station in mainland Australia and its isolation in a desert makes it an ideal place to study the issue of temperature spread. It is virtually in the middle of the Continent.It is far from influencing factors such as Urban Heat Island effect, land use changes, encroachment by shading vegetation, shading by buildings and so on, that can potentially corrupt the data. Humidity is usually low and stable and it is far from the sea. In addition, as a sign of its importance in the BoM network, Giles is permanently staffed.

As stated, the IPCC hypothesis is that the ‘gap’ will become steadily smaller as the Enhanced Greenhouse Effect takes hold. As temperature rises the gap will narrow and this will result in an increase in average temperature, so says the IPCC.

Moore’s research indicates that this is just not happening at this showcase BoM site. It may be happening elsewhere, and this needs to be tested in each case against the range of all data-corrupting effects, but it is not happening at Giles.

Notes about the graphs. The top plot line shows the average Tmax for each year – that is, the average maximum daytime temperature. The middle plot shows the average Tmin for each year – that is, the average minimum night time temperature.

The lower plot shows the result of the calculation Tmax-Tmin. In laypersons’ terms it is the result you get when you subtract the average yearly minimum temperature from the average yearly maximum temperature. If the IPCC hypothesis is valid, then the lower plot line should be falling steadily through the years because, according to the IPCC, more carbon dioxide in the atmosphere should make nights warmer. Hence, according to the IPCC’s hypothesis, the gap between Tmax and Tmin will become smaller – ie the gap will narrow. But the plot line does not show this.

The IPCC’s reasoning for its narrowing prediction is that global warming will be driven more by a general rise in minimum temps that it will be by a general rise in maximums. This is not my assertion, nor is it Dr. Moore’s, it is the assertion of the IPCC and can be found in the IPCC’s AR4 Report. 

Dr. Moore states, “In the AR4 report the IPCC claims that elevated CO2 levels trap heat, specifically the long wave radiation escaping to space.

“As a result of this the IPCC states at page 750 that, ‘almost everywhere night time temperatures increase more than day time temperatures, that decrease in number of frost days are projected over time, and that temperatures over land will be approximately twice average Global temp rise,” he says citing page 749 of the AR4 report. 

So where can we go to find evidence that the IPCC assertion of a narrowing spread of Tmax-Tmin is either happening or not happening? Giles is a great start point. Can we use the BoM’s own publicly available data to either confirm, or disprove, the narrowing prediction? The short answer is – Yes we can.

But, before we all get too excited about the result Dr. Moore has found, we need to recognise the limitation that this is just one site and, to the cautious scientific mind, may still be subject to some bizarre influence that somehow skews the result away from the IPCC prediction. If anyone can suggest what viable contenders for ‘bizarre influences’ might be at Giles we would welcome them in the comments section of this post. 

The caution validly exercised by the rigorous scientific mind can be validly balanced by the fact that Giles is a premier, permanently staffed and credible site. The station was also set up with great care, and for very specific scientific purposes, in the days of the Cold War as part of the British nuclear test program in Australia in the 1950’s. It was also important in supplying timely and accurate meteorological data for rocket launches from the Woomera Rocket Range in South Australia in the development of the Bluestreak Rocket as part of the British/Australian space program. This range extended almost all the way across Australia from the launching site at Woomera to the arid North West of Western Australia.

In the early years there were several other weather monitoring stations along the track of the range. Such has been the care and precision of the operation of the station that Giles has the characteristics of a controlled experiment. 

Dr. Moore states, “Giles is arguably the best site in the World because of its position and the accuracy and reliability of its records which is a constant recognised problem in many sites. Data is freely available on the BoM website for this site.”

With regard to the site validly having the nature of a controlled experiment, something about the method of analysis is also notable. The novel adoption of deriving the spread Tmax-Tmin  by doing it on a daily basis neatly avoids meta data issues that have plagued the reliability of data from other stations and sometimes skewed results from other supposedly reliable observation sites.

“I would argue that the only change in environmental conditions over the life of this station is the increase in CO2 from 280 to 410 ppm,” he says.

“In effect this is, I suggest, a controlled experiment with the only identifiable variable input being CO2 concentration,” he says.  

The conclusion reached by Dr. Moore is that an examination of the historical records for this site by accessing the same data through the BoM website unequivocally shows NO significant reduction in Tmax-Tmin. It also shows no rise in Tmin. Anyone can research this data on the Bureau of Meteorology website as it is not paywalled. It is truly sound data from a government authority for the unrestricted attention of citizens and other researchers.  

Dr. Moore concludes, “The logical interpretation of this observation is that, notwithstanding any other unidentified temperature influencing factor, the Enhanced Greenhouse Effect due to elevated CO2 had no discernible effect on temperature spread at this site. And, by inference, any other site.”

He further states, “On the basis of the observations I have made, there can be no climate emergency due to rising CO2 levels, whatever the cause of the rise. To claim so is just scaremongering.

“Any serious climate scientist must surely be aware of such basic facts yet, despite following the science for many years, I have never seen any discussion on this specific approach,” he says.

Finally, Dr. Moore poses a few questions and makes some pertinent points:

He asks, “Can anyone explain, given the current state of the science why there is no rise in minimum temperatures (raw) or, more importantly, no reduction in Tmax-Tmin spread, over the last 65 years of records despite a significant rise in CO2 levels at Giles (280-410ppm) as projected by the IPCC in their AR4 report?” He notes that other published research indicates similar temperature profiles in the whole of the central Australian region as well as similarly qualified North American and World sites.

Seeking further input, he asks, “Can anyone provide specific data that demonstrates that elevated CO2 levels actually do increase Tmin as predicted by the IPCC?” And further, “Has there been a reduction in frost days in pristine sites as predicted by the IPCC?”

On a search for more information, he queries, “Can anyone explain why the CSIRO ‘State of the Climate’ statement (2020) says that Australian average temperatures have risen by more than 1 deg C since 1950 when, clearly, there has been no such rise at this pristine site?” With regard to this question, he notes that Giles should surely be the ‘go to’ reference site in the Australian Continent.

Again he tries to untangle the web of conflicting assertions by reputedly credible scientific organisations. He notes that, according to the IPCC rising average temperatures are attributable to rise in minimum temperatures. For the CSIRO State of the Climate statement to be consistent with this, it would necessitate a rise of around 2 deg C in Tmin. But, at Giles, there was zero rise. He also notes that, according to the IPCC, temperature rises over land should be double World average temperature rises. But he can see no data to support this. 

Dr. Moore’s final conclusion: “Through examination of over 65 years of data at Giles it can be demonstrated that, in the absence of any other identifiable temperature forcing, the influence of the Enhanced Greenhouse Effect at this site appears to be zero,” he says. “Not even a little bit!” 

David Mason-Jones is a freelance journalist of many years’ experience. He publishes the website www.bomwatch.com.au

Dr. Lindsay Moore, BVSC. For approaching 50 years Lindsay Moore  has operated a successful veterinary business in a rural setting in the Australian State of Victoria. His veterinary expertise is in the field of large animals and he is involved with sophisticated techniques such as embryo transfer. Over the years he has seen several major instances in veterinary science where something that was once accepted on apparently reasonable grounds, and adopted in the industry, has later been proven to be incorrect. He is aware that this phenomenon is not only confined to the field of Veterinary Science but is happens in other scientific fields as well. The lesson he has taken from this is that science needs to advance with caution and that knee-jerk assumptions about ‘the science is settled’ can lead to significant mistakes. Having become aware of this problem in science he has become concerned about how science is conducted and how it is used. He has been interested in the global warming issue for around 20 years.   

General link to Bureau of Meteorology website is www.bom.gov.au

4. Rockhampton, Qld

Dr. Bill Johnston[1]

 Main Points

  • Aerial photographs and archived plans and documents unequivocally show the Stevenson screen at Rockhampton airport moved about 450 m from beside the northern boundary of the aerodrome to a mounded site south of the runways before May 1956. The move was not reported in site-summary or ACORN-SAT[2] metadata and the substantial change in exposure appeared to have been adjusted-out of the data using parallel observations that continued possibly until the 1960s.
  • A satellite communications unit (SatCom) installed within 25 m of the second site in 1986/87 caused maximum temperature to step-up 0.48oC. Also undocumented by metadata, the abrupt increase was ignored to imply it was due to the climate.
  • The cause of an upward step-change in 2013 (0.95oC) was not specifically identified. However, as it was not related to site changes or the climate, it was either due to a local instrument fault or a problem with off-site data processing. Everything considered, it could not be ruled out that recent data were manipulated so daily maximum temperatures appeared warmer by up to 2.2oC on warm days.
  • Adjusted for rainfall, site-related changes caused Tmax to warm 1.44oC overall and after step-changes and rainfall were accounted-for no unexplained changes or trends remained that could be attributed to the climate. 

Background

The Rockhampton airport weather station (ID 39083) is an Australian Climate Observations Reference Network – Surface Air Temperature site used to estimate Australia’s warming. As is the case for other ACORN-SAT sites, since the early 1990s when they commenced homogenising Australian temperature data, Bureau climate scientists have claimed repeatedly that site-histories used to pinpoint changepoints and make adjustments were exhaustively researched. However, to their discredit, like at Cairns and Townsville, they ignored that the original meteorological enclosure at Rockhampton (Figure 1) moved about 450 m south to a substantially different exposure before May 1956. Furthermore, it appears the effect on data was adjusted-out using parallel observations that continued possibly until the 1960s.

As if to blame the climate, Bureau scientists also ignored that a satellite communications module (SatCom) installed close to the second site in 1986/87 (Figure 2) caused mean annual maximum temperature (Tmax) to abruptly step-up 0.48oC from 1987.


Figure 1. (Left) The original Rockhampton weather station (met) was located was located on the northern boundary of the aerodrome behind the Aeradio office (mo), which was established by Amalgamated Wireless Australasia on behalf of the Civil Aviation Board in 1939. Other buildings shown in the May 1956 aerial photograph were H2, the hydrogen generator for filling balloons used to estimate windspeed and direction; (h) the pre-WWII hanger, (t) the terminal, (twr) tower and signal square (ss) used for visual communication. Although Bureau staff moved to the new control tower complex in 1961, the met-enclosure was still maintained until at least June 1966 (right).    

A step-change in 2013 (0.95oC) was not related to the climate but was caused by over-reporting of high-range daily values. The change appeared to have coincided with the AWS being hard-wired to the Bureau’s computers in Melbourne where data were processed into daily maxima, minima and 10-minute and half-hourly observations. As the Stevenson screen had been changed from 230 to 80-litres well before (on 22 March 2000) and no site changes were evident in satellite images; it was highly unlikely that while distributions of upper-range minimum temperatures (daily Tmin >18oC) were cooler after 2013, the highest 10% of daily observations (Tmax >33oC) were warmer by up to 2.2oC.

Further, while the record-highest temperature on 18 November 1990 (45.3oC) occurred before the site moved away from the SatCom and should be disregarded, it is implausible that the second highest value of 44.4oC on 28 November 2018 was 2.7oC over-range relative to the percentile distribution of pre-2013 data.

Although evidence was circumstantial, either the instrument, including its calibration was faulty or the problem occurred during processing. Given there were no parallel observations or a paper-trail, and bearing in-mind the Bureau’s penchant for declaring daily, monthly and annual ‘records’ somewhere almost every day, it cannot be ruled out that data were jigged higher on warm days.

Click here for full paper, photographs and tables of data.

Discussion

Moving a weather station is not a simple matter and it is not possible that the pre-1956 move was not recorded in Bureau files. It required negotiation with the Royal Australian Air Force and the Department of Civil Aviation; recommendations and approvals of expenditure at Director level; requisitions to the Department of Public Works (Cwth) for building the mound and installing equipment and it may have taken months to complete. Following the move parallel observations were made for several more years. Adding to the debacle, it appears data were changed to hide the move, which further undermines trust in the integrity of the Bureau’s data management processes.

Figure 2. An undated oblique view of the Rockhampton weather station and large SatCom dish copied from a 2011 ACORN-SAT Station catalogue (left); and (right) the same site from a different perspective copied from the most recent catalogue. Installation of the SatCom in 1986/87 caused maximum temperature to step-up 0.48oC.   

It is also not possible that observers were unaware that the SatCom was installed 20 to 30 m from the previous site in 1986/87 or that it generated heat that affected measurements. Also perverse is that the 1987 step-change, which was highly significant in both time and rainfall domains, was not detected or adjusted by data homogenisation. Likewise, multiple analyses of the 2013 step-change found it was due to either an instrument fault or off-site data processing, not the climate.

Despite at least four homogenisation iterations of the same data, failure to detect and adjust the 1987 step-change exposed major weaknesses in the Bureau’s methods. Homogenisation lacks scientific objectively, rigour and oversight; while picking and choosing changepoints and applying arbitrary adjustments allows changes and trends in homogenised data to be pre-determined.

Finally, at all levels (publication in scientific journals; the Bureau’s annual climate statements and reviews; CSIRO’s State of the Climate reports, supporting documents and advice to governments; grey-science news stories spread by the Climate Commission, the Conversation, the Climate Council, WWF and the ABC, in-house reviews and ‘independent’ technical audits) the peer-review process failed dismally to detect problems and biases.

Changepoint identification based on poorly researched and misleading metadata and application of arbitrary and inconsistent adjustments is neither credible nor scientific and should be abandoned.

An important link – find out more

Click here for full paper, photographs and tables of data.

The page you have just read is the basic cover story for the full paper. If you are stimulated to find out more, please link through to the full paper – a scientific Report in downloadable pdf format. This Report contains far more detail including photographs, diagrams, graphs and data and will make compelling reading for those truly interested in the issue.

Bill Johnston, 5 April 2020

Click here for full paper, photographs and tables of data.

[1] Dr. Bill Johnston’s scientific interests include agronomy, soil science, hydrology and climatology. With colleagues, he undertook daily weather observations from 1971 to 1979. 

[2] Australian Climate Observations Reference Network – Surface Air Temperature

Climate at Townsville

Dr. Bill Johnston

Dr. Bill Johnston’s scientific interests include agronomy, soil science, hydrology and climatology. With colleagues, he undertook daily weather observations from 1971 to 1979.

Abstract

Main points

  • Aerial photographs and Royal Australian Air Force plans and documents held by the National Library and National Archives of Australia show the Stevenson screen at Townsville airport moved at least three, possibly four times before 1969 while it was on the eastern side of the main runway; and probably twice between when it moved to a mound on the western side in January 1970 and to the current automatic weather station site in December 1994.
  • Of those site changes, a site move in 1953/54 and another in 1970 resulted in step-changes in maximum temperature data that were unrelated to the climate. A step-change in minima in 1968 appeared to be due to nearby disturbances associated with building an extension to the met-office. Importantly, except in the Bureau’s Garbutt instruments file, which is online at the National Archives (Barcode 12879364), none of the relocations or nearby changes are listed or described in site-summary metadata.   
  • By ignoring prior changes and smoothing the 1994 transition to the automatic weather station and small (60-litre) Stevenson screen, homogenisation created trends in maximum and minimum temperature that had nothing to do with the climate. 
  • Accounting simultaneously for site-related changes and covariates (rainfall for Tmax and Tmax for Tmin) leaves no residual trend, change or cycles attributable to the climate. Thus there is no evidence that the climate has warmed or changed.

Background

Like many of Australia’s ACORN-SAT weather stations[1], the site at Townsville airport was set-up in 1939 as an Aeradio office for monitoring air-traffic and to provide advice of inclement weather along the east coast route between Melbourne and Port Moresby.

Changes in facilities, instruments and functions caused the site to move irregularly; however, moves and changes prior to December 1994 were not detailed in ACORN-SAT or site-summary metadata. Despite repeated assurances in peer-reviewed publications written by Bureau climate scientists and others, that the history of ACORN-SAT sites had been exhaustively researched and appropriate adjustments had been made for the effect of site changes on data, it was not the case at Cairns and neither is it true for Townsville.

As there is no measurable change or warming in temperature data for Townsville Airport, claims of catastrophic consequences for the Great Barrier Reef are unfounded in the temperature data and, as a consequence, are grossly overstated.

An important link – find out more

The page you have just read is the basic cover story for the full paper. If you are stimulated to find out more, please link through to the full paper – a scientific Report in downloadable pdf format. This Report contains far more detail including photographs, diagrams, graphs and data and will make compelling reading for those truly interested in the issue.

Click here to download the full paper including photographs and tables of data used.

Note: Line numbers are provided in the linked Report for the convenience of fact checkers and others wishing to provide comment. If these comments are of a highly technical nature, relating to precise Bomwatch protocols and statistical procedures, it is requested that you email Dr Bill Johnston directly at scientist@bomwatch.com.au referring to the line number relevant to your comment.   


[1] http://www.bom.gov.au/climate/change/acorn-sat/documents/ACORN-SAT-Station-Catalogue-2012-WEB.pdf

Climate at Cairns

Dr. Bill Johnston

Dr. Bill Johnston ‘s scientific interests include agronomy, soil science, hydrology and climatology. With colleagues, he undertook daily weather observations from 1971 to 1979.

Abstract

Main points

  • Like many historical datasets, conditions affecting temperature measured at the Cairns post office are largely unknown. Site changes in 1900 and 1924 occurred in parallel with observations and an objective statistical method and post hoc attribution of changepoints as detailed previously for Gladstone Radar is preferable to relying on incomplete and possibly misleading metadata.
  • Metadata incorrectly specifies the location of the original aerodrome site near the 1939 Aeradio office and ignored the move to the mounded-site near the centre of the airport in 1966 and also that the site moved in September 1983 out of the way of a new taxiway. During construction when neither site was operational, aerial photographs show a fourth site was established near the location of the current automatic weather station. Data from that site either in-filled the record or were used to adjust for the 1983 move. A highly significant step-change in 1986 plausibly marked when in-filling or adjustments ceased.
  • Rainfall reduced Tmax 0.033oC/100 mm and together with site changes accounted for 53.7% of Tmax variation. Step-changes at the post office in 1900, 1924 and 1929 and at the airport in 1986 caused 1.01oC of warming in the data and there is no residual trend or change attributable to the climate.

Background

Cairns is located in northern Queensland and is the main tourist-hub for visitors to Port Douglas, the wet-tropics hinterland and the northern Great Barrier Reef (GBR). It is often in the news that survival of the GBR is threatened by climate change warming and following a coordinated ‘save the reef’ campaign in April 2018 the Great Barrier Reef Foundation was gifted almost $0.5b by then Prime Minister Malcolm Turnbull. While WWF and related entities including AYCC, GetUp! and the Climate Council continuously bang the same drum, the question remains: to what extent is the climate of the GBR changing or warming?

The best way to find out is to grab some data, undertake research and find out what is going-on.

Merged in October 1942, one hundred and twenty years of post office and airport data showed no evidence that the climate at Cairns has changed or warmed. No marked increases have occurred in the frequency of maximum temperature extremes and nothing suggests temperature is likely to increase markedly in the future.

Being a whole-of-government enterprise, climate change and warming has been created by Bureau of Meteorology scientists who ignored site changes that happened and adjusted for some that didn’t to cause warming in homogenised data that doesn’t exist. ACORN-SAT metadata claimed the only move at the airport was in December 1992 when the “site moved 1.5 km northwest (to the other side of the runway)”; which isn’t true. Picked-up by the ABC, The Conversation, Guardian, the former Fairfax press; numerous web-sites and professors dependent on funding from the Australian Research Council; it has all rested on an extremely dubious, and superficial, level of statistical analysis. It must surely be deeply concerning to any competent statistical analyst that the Bureau of Meteorology BOM) has only the most rudimentary knowledge of site changes at Cairns – site changes that have created significant step changes in the data. Exhaustive research into historical Public Works records reveals significant site changes affecting the temperature record at Cairns.

It is of concern that so much money has fallen out of the sky to address a problem that cannot be confirmed by a rigorous analysis of the data.         

An important link – find out more

The page you have just read is the basic cover story for the full paper. If you are stimulated to find out more, please link through to the full paper – a scientific Report in downloadable pdf format. This Report contains far more detail including photographs, diagrams, graphs and data and will make compelling reading for those truly interested in the issue.

Click here to download the full paper including photographs and tables of data used.

Note: Line numbers are provided in the linked Report for the convenience of fact checkers and others wishing to provide comment. If these comments are of a highly technical nature, relating to precise Bomwatch protocols and statistical procedures, it is requested that you email Dr Bill Johnston directly at scientist@bomwatch.com.au referring to the line number relevant to your comment.   

[1] Dr. Bill Johnston’s scientific interests include agronomy, soil science, hydrology and climatology. With colleagues, he undertook daily weather observations between 1971 and 1979.

About

Welcome to BomWatch.com.au a site dedicated to examining Australia’s Bureau of Meteorology, climate science and the climate of Australia. The site presents a straight-down-the-line understanding of climate (and sea level) data and objective and dispassionate analysis of claims and counter-claims about trend and change.

BomWatch delves deeply into the way in which data has been collected, the equipment that has been used, the standard of site maintenance and the effect of site changes and moves.

Dr. Bill Johnston is a former senior research scientist with the NSW Department of Natural Resources (abolished in April 2007); which in previous guises included the Soil Conservation Service of NSW; the NSW Water Conservation and Irrigation Commission; NSW Department of Planning and Department of Lands. Like other NSW natural resource agencies that conducted research as a core activity including NSW Agriculture and the National Parks and Wildlife Service, research services were mostly disbanded or dispersed to the university sector from about 2005.

BomWatch.com.au is dedicated to analysing climate statistics to the highest standard of statistical analysis

Daily weather observations undertaken by staff at the Soil Conservation Service’s six research centres at Wagga Wagga, Cowra, Wellington, Scone, Gunnedah and Inverell were reported to the Bureau of Meteorology. Bill’s main fields of interest have been agronomy, soil science, hydrology (catchment processes) and descriptive climatology and he has maintained a keen interest in the history of weather stations and climate data. Bill gained a Batchelor of Science in Agriculture from the University of New England in 1971, Master of Science from Macquarie University in 1985 and Doctor of Philosophy from the University of Western Sydney in 2002 and he is a member of the Australian Meteorological and Oceanographic Society (AMOS).

Bill receives no grants or financial support or incentives from any source.

BomWatch accesses raw data from archives in Australia so that the most authentic original source-information can be used in our analysis.

How BomWatch operates

BomWatch is not intended to be a blog per se, but rather a repository for analyses and downloadable reports relating to specific datasets or issues, which will be posted irregularly so they are available in the public domain and can be referenced to the site. Issues of clarification, suggestions or additional insights will be welcome.   

The areas of greatest concern are:

  • Questions about data quality and data homogenisation (is data fit for purpose?)
  • Issues related to metadata (is metadata accurate?)
  • Whether stories about datasets consistent and justified (are previous claims and analyses replicable?)

Some basic principles

Much is said about the so-called scientific method of acquiring knowledge by experimentation, deduction and testing hypothesis using empirical data. According to Wikipedia the scientific method involves careful observation, rigorous scepticism about what is observed … formulating hypothesis … testing and refinement etc. (see https://en.wikipedia.org/wiki/Scientific_method).

The problem for climate scientists is that data were not collected at the outset for measuring trends and changes, but rather to satisfy other needs and interests of the time. For instance, temperature, rainfall and relative humidity were initially observed to describe and classify local weather. The state of the tide was important for avoiding in-port hazards and risks and for navigation – ships would leave port on a falling tide for example. Surface air-pressure forecasted wind strength and direction and warned of atmospheric disturbances; while at airports, temperature and relative humidity critically affected aircraft performance on takeoff and landing.

Commencing in the early 1990s the ‘experiment’, which aimed to detect trends and changes in the climate, has been bolted-on to datasets that may not be fit for purpose. Further, many scientists have no first-hand experience of how data were observed and other nuances that might affect their interpretation. Also since about 2015, various data arrive every 10 or 30 minutes on spreadsheets, to newsrooms and television feeds largely without human intervention – there is no backup paper record and no way to certify those numbers accurately portray what is going-on.

For historic datasets, present-day climate scientists had no input into the design of the experiment from which their data are drawn and in most cases information about the state of the instruments and conditions that affected observations are obscure.

Finally, climate time-series represent a special class of data for which usual statistical routines may not be valid. For instance, if data are not free of effects such as site and instrument changes, naïvely determined trend might be spuriously attributed to the climate when in fact it results from inadequate control of the data-generating process: the site may have deteriorated for example or ‘trend’ may be due to construction of a road or building nearby. It is a significant problem that site-change impacts are confounded with the variable of interest (i.e. there are potentially two signals, one overlaid on the other).

What is an investigation and what constitutes proof?

 The objective approach to investigating a problem is to challenge the straw-horse argument that there is NO change, NO link between variables, NO trend; everything is the same. In other words, test the hypothesis that data consist of random numbers or as is the case in a court of law, the person in the dock is unrelated to the crime. The task of an investigator is to open-handedly test that case. Statistically called a NULL hypothesis, the question is evaluated using probability theory, essentially: what is the probability that the NULL hypothesis is true?

In law a person is innocent until proven guilty and a jury holding a majority view of the available evidence decides ‘proof’. However, as evidence may be incomplete, contaminated or contested the person is not necessarily totally innocent –he or she is simply not guilty.

In a similar vein, statistical proof is based on the probability that data don’t fit a mathematical construct that would be the case if the NULL hypothesis were true. As a rule-of-thumb if there is less than (<) a 5% probability (stated as P < 0.05) that that a NULL hypothesis is supported, it is rejected in favour of the alternative. Where the NULL is rejected the alternative is referred to as significant. Thus in most cases ‘significant’ refers to a low P level. For example, if the test for zero-slope finds P is less than 0.05, the NULL is rejected at that probability level, and trend is ‘significant’. In contrast if P >0.05, trend is not different to zero-trend; inferring there is less than 1 in 20 chance that trend (which measures the association between variables) is not due to chance.

Combined with an independent investigative approach BomWatch relies on statistical inference to draw conclusions about data. Thus the concepts briefly outlined above are an important part of the overall theme. 

Using the air photo archives available in Australia, Dr Bill Johnston has carried out accurate and revealing information about how site changes have been made and how these have affected the integrity of the data record.