Is homogenization of Australian weather data any good?
Dr Bill Johnston[1]
Situated 443 km south of Darwin, 410 km NE of Halls Creek and 433 km north of Rabbit Flat in the Kimberley Region of the Northern Territory, the iconic Victoria River Downs Station was once the largest pastoral holding in the world. The station homestead beside the Ord River (Figure 1), is the location of an Australian Climate Observations Reference Network – Surface Air Temperature dataset (ACORN-SAT) weather station, one of 112 such sites used to monitor climate warming in Australia. Due to the sparseness of the Bureau of Meteorology’s (BoM) network in northern Australia, data for Victoria River Downs (BoM ID 14825) is weighted by ACORN-SAT to be representative of some 3.3% of Australia’s land area.
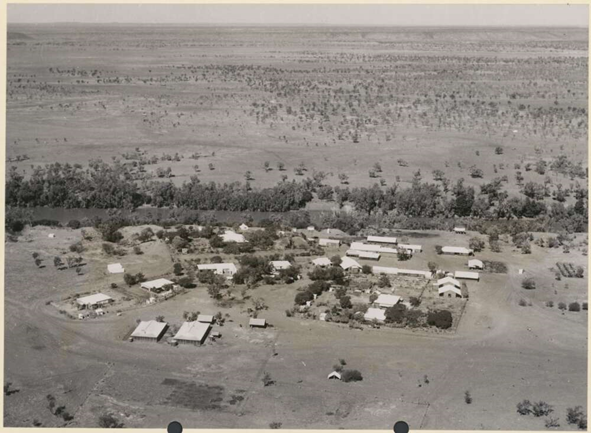
Figure 1. The Victoria River Downs homestead and outbuildings south of the Ord River in the Kimberley Region of the Northern Territory in 1954 (National Library of Australia, copyright expired: https://nla.gov.au:443/tarkine/nla.obj-137684286).
From when observations commenced in 1965 until about 1979 data were plagued by runs of missing observations, or low data counts per month. Observations were also mostly reported in whole and ½oC from 1975 to 1982. The frequency of whole degrees was higher than other decimal-fractions from when the automatic weather station (AWS) was installed in May 1997 until about 2006. Site-surrounds and the lawn beyond were also irregularly watered. Maximum temperature data (Tmax) could not therefore be judged as high-quality. As data were unavailable from June to September 1973 (N=210), 1973 was omitted from the analysis.
The overall Tmax trend of 0.125oC/decade (P = 0.055) was spuriously due to an abrupt Tmax up-step of 1.12oC in 2013, which was not related to a change in the weather or climate. Accounting for that and the effect of rainfall on observations, left no additional signals that could be attributed to CO2, coalmining, electricity generation or anything else.
The change may have been due to cessation of watering (which was said to have ceased in 2007), replacement of a former 230-litre Stevenson screen with a 60-litre one, or replacement of a wooden 60-litre screen with a plastic one. According to site-summary metadata the Tmax thermometer was removed in July 2012 (thus backup manual observations ceased), but curiously, it was re-installed in March 2016 and replaced again in September 2019. Like many ACORN-SAT sites, metadata (data about the data) is vague and unreliable and not a basis for correcting data for site-change effects.
Consistent with the First Law of Thermodynamics, analysis of trend and change was undertaken using BomWatch protocols that are transparent, objective, and replicable, and cannot be ‘fiddled’ to achieve pre-determined outcomes.
With the First Law onside, nothing can possibly go wrong.
Tmax depends on rainfall such that the drier it is the hotter it gets. If the relationship between Tmax and rainfall is not significant, weak or positive, something is wrong with the data, not the First Law Theorem. Further, if variation explained (R2adj) is less than a benchmark of 0.50 (or 50%) data may either embed a ‘missing variable’ (one that is not explained by the naïve Tmax ~ rainfall case), or the quality of data is arguably too poor for determining trend and change in the climate.
Site related inhomogeneities occur in parallel with observations and are therefore confounded with the Tmax signal. However, as the Tmax ~ rainfall relationship implicitly accounts for the rainfall effect, non-rainfall residuals embed all other sources of variation, including underlying systematic changes related to site-changes. The second step in the Protocol investigates residuals for significant shifts or step-changes in re-scaled residuals indicative of such factors. Importantly, changepoints are detected objectively and cannot be specified in advance.
Identified using a factor variable, final-round analysis verifies that segmented responses to rainfall are the same (slopes are parallel), and that rainfall-adjusted segment means are different (that individual relationships are offset). Each of the three BomWatch protocol steps is transparent, objective and replicable, and supported by subsidiary investigations including analysis of residuals and post hoc tests.
Homogenisation is near the limit of plausibility
The same protocols used to analyse Tmax were used to evaluate homogenisation of the same data by ACORN-SAT.
Three iterations of ACORN-SAT applied adjustments at different times such that past-data were cooled and/or warmed to varying extents toward the present, which is a trick that affects trend. However, while adjustments may stabilise and improve statistical significance (and possibly moderate data quality problems), segmented relationships with rainfall become less clear-cut and less precise overall. Lack of statistical control and the absence of post hoc evaluations is a major weakness of ACORN-SAT.
The political narrative supported by ACORN-SAT will eventually be shown to be false, either as more ACORN-SAT sites are analysed using rigorous BomWatch protocols; or, as time passes and BoM scientists run out of options for making adjustments that seem plausible; or, adjustments cause fundamental Tmax ~ rainfall relationships to break-down. The question then arises: just how many more analyses are needed? or, how many years need to pass, before ACORN-SAT is shown irrevocably to be too unsound, unscientific and unbelievable to continue? As the ACORN-SAT project is unsalvageable, for the sake of those involved it should be abandoned without exception, in its entirety.
Implications
The practical implication is that most messaging related to climate warming in Australia, including the indoctrination of vulnerable schoolchildren and young adults, and State of the Climate reports published by CSIRO, is demonstrably fake. The whole warming agenda has been made-up and carried forward since the call went-out from the World Meteorological Organisation in about 1989 to find and supply data that supported future Intergovernmental Panel on Climate Change (IPCC) reports. Temperature data homogenisation resulted from that.
The scientific implication is that along with models used to predict future climates, scores, possibly thousands of scientific papers and reports that depend on the warming narrative, are worthless.
Studies related to the effect of ‘a warming world’ on health, on agriculture, tourism, urban planning, the Murray-Darling Basin, the Great Barrier Reef, urban water supplies, species extinctions, and for converse reasons, on mining and resource use, are based on a premise that has been fabricated by consensus from the beginning.
The political implication is that the billions of dollars that have been spent on, or are intended to be spent, in order to limit warming to the mythical value of 1.5oC sometime in the future, is entirely wasted. With the national debit spiralling out of control, crippling electricity prices, subsidies and carbon taxes flowing from diminishing numbers of primary producers and workers to the elites, will eventually cripple Australia’s ability to remain sovereign, democratic and free.
As The Science is underpinned by data that has been fabricated to support it, and as the manipulations of past-data will become increasingly implausible going forward, the whole edifice must eventually collapse. Collapse will probably occur within a decade, possibly sooner than 2030.
Finally, as Tmax depends on rainfall, which in Australia is stochastic (unpredictable) and episodic (occurs in episodes), without knowing rainfall in advance, it is impossible to predict the trajectory of Tmax into the future.
Dr Bill Johnston
15 February 2024
Preferred citation:
Johnston, Bill 2024. Is homogenisation of Australian temperature data any good? Part 7. Victoria River Downs, Northern Territory, Australia http://www.bomwatch.com.au/ 15 pp.
Click here to download the full paper with photos, graphs and data
Click here for the full Victoria River data
[1] Former NSW Department of Natural Resources research scientist and weather observer.