Monthly Archives: August 2021

Sea Temp Townsville QLD

Trends in sea surface temperature at Townsville, Great Barrier Reef, Queensland

Dr. Bill Johnston[1]

http://www.bomwatch.com.au/

(scientist@bomwatch.com.au)

Main points

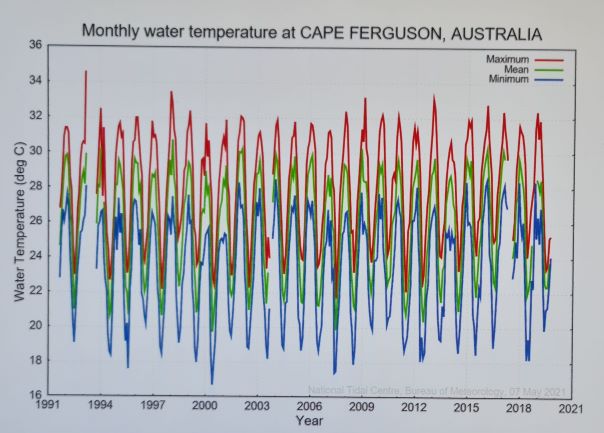
#1. Heat exchanges with the landscape bias trends in sea surface temperature (SST) measured close to shore such as at Cape Ferguson near Townsville (Latitude -19.2774o, Longitude 147.0586o), especially during periods of low summer rainfall when maximum temperature (Tmax) is axiomatically higher. Removing seasonal cycles, which show no trend, and accounting for the significant effect of terrestrial Tmax and barometric pressure (hPa), left no trend of change attributable to any other factor. While Tmax is clustered into dry-warm and moist-cool years, there is no evidence that SST has warmed since records commenced in September 1991.

#2. At Cape Ferguson SST cools more slowly from its peak in January to July than it warms from August to to December. Great Barrier Reef (GBR) ecosystems must therefore be adapted to the 8.1C interannual cycle and average month-to-month SST changes of up to 2C.

#3. Australian Institute of Marine Science (AIMS) SST data is short, patchy, poorly dispersed towards the extremities of the Reef and not useful for estimating trend. Selecting day-of-year averages for 27 sites extending from Thursday Island Cape York to North Solitary Island in the south showed Reef ecosystems are adapted to average temperatures between 27C to greater than 29C and greater than 30C for four to five months, and less than 20C in winter (July to September). Highest average SST is predicted to be 29.64C ( ±PI 1.12oC) at Latitude ‑13.5o in late January; SST cools slightly towards the equator.

#4. The Southern Equatorial Current which splits to form the North Queensland current and the East Australian Current (which dissipates south into the Tasman Sea) is cooled continuously by convection, long-wave re-radiation to space by towering clouds, cool rainfall and the formation of reflective residual cirrus ice-clouds. These processes maintain SST within close limits that rarely and only transiently exceed 30oC.

#5. No difference was found between temperatures measured between Port Stephens and Cape Sidmouth in November and December 1871 and data for those times derived from AIMS datasets. Further, data does not support claims by AIMS, the Great Barrier Reef Marine Park Authority, The Australian Museum, the Great Barrier Reef Foundation and groups including WWF and the Climate Council that sea surface temperature has increased by an unremarkable 0.8oC or that continued warming is likely to threaten survival of the Reef.

#6 Near the Equator the water cycle operates as a self-regulating heat-pump that catapults moisture high into the atmosphere to form cloud that reflects or rejects incoming solar energy during the monsoon and thereby limits input of warm waters to the North Queensland and East Australian currents. There is no evidence that the process has broken-down or is likely to break down in the future.

Background

With operations in Townsville, Darwin and Perth, AIMS is part of arguably the largest, most expensive and elite conglomerate of research institutions in Australia. Spread across multiple universities and state and commonwealth agencies and with strong support from the Australian Research Council, their research focuses on the effect of climate change on Australia’s Great Barrier Reef. They and partner organisations including CSIRO and the Great Barrier Reef Marine Park Authority (GBRMPA), Great Barrier Reef Foundation, WWF and the Climate Council have consistently claimed survival of the Reef is imperiled by rising seas and anthropogenic warming. For instance, GBRMPA states unequivocally[2] that “Australia’s climate has warmed on average by 1.44 degrees Celsius since national records began in 1910, with most warming occurring since 1950 and every decade since then being warmer than the ones before”; and that “sea surface temperatures in the Australian region have warmed by around 1 degree Celsius since 1910, with the Great Barrier Reef warming by 0.8 degrees Celsius in the same period”.

Research reported here investigates that claim. The main question is:

  • Is mean SST increasing, and if so, at what rate.

What we did

Using average SST data from September 1991 for the fixed tide gauge at Cape Ferguson, which is part of the Australian baseline Sea Level Monitoring Project run by Australia’s Bureau of Meteorology (BoM), we aimed to distinguish between variables that caused variation IN SST from latent factors that may have impacted ON the data-stream (impact variables). Multiple linear regression (MLR) was used to investigate variation IN SST, while factors that impacted ON the data-stream were investigated using step-change analysis of MLR residuals (SST with covariable effects removed). 

Commencing on 28 November 1871, SST was measured between Port Stephens and Cape Sidmouth near the top of Cape York by astronomers from Melbourne and Sydney who sailed on the Governor Blackall to observe the total eclipse of the sun and also on their return voyage commencing 13 December. They used bucket samples taken near the bow of the steamer each hour between 6 am and 6 pm each day. Data were summarised and coordinates were estimated from accompanying notes using Google Earth Pro. Although published in 1877, the data has never been used before to benchmark data collected more recently by AIMS. (National Library of Australia call number NL 551.56 R963.)

As AIMS data consisted of varying numbers of daily observations, collected using a variety of dataloggers and sensors over variable time periods, averages were calculated for 27 sites spanning the Reef corresponding to the time of the 1877 voyages and mainly at the start and middle of each calendar month. Datasets were analysed as transects using polynomial regression and compared statistically and graphically.

The Cape Ferguson, 1871 and derived AIMS SST datasets used in the study are available here .

Principal findings

Data measured close to shore was contaminated by heat transfers with the landscape. Thus, data for Cape Ferguson (and some AIMS dataloggers, notably several in Torres Strait) was warmer during dry hot summers and did not truly reflect SST.  

The Eastern Australian Current warms rapidly from November to December and temperature measured on the journey to Cape Sidmouth in 1871 was significantly cooler than values for the return voyage to Port Stephens. However, despite spatial and temporal uncertainties and within and between year variation in the behavior of the currents, confidence bands for AIMS data averaged for 01 and 15 November overlapped those for the voyage north from Port Stephens and were therefore not different. Within the Latitude limits of where datasets overlap, AIMS data for 04 and 18 December, 01 January and 15 and 01 February, are also not different to data for the return voyage from 13 to 24 December 1871.

Furthermore, toward its northern extremity (Bramble Cay, Latitude ‑9.08o, for which there is no useful AIMS data), while SST increases steadily from 01 November to mid-December, from then until March, SST does not exceed between 29o and 30oC. The curvilinear response evidenced an upper-limit to SST, which is rarely or only briefly exceeded.

Average monthly SST attains a plateau in late November that persists until the cooling phase commences in March. SST in the range 27oC to 29oC from November to late March provides a five-month growing season for corals, which combined with the minimum of around 20oC in July (North Keppel Island) defines the ecotone limit of Reef ecosystems.

North Solitary Island is too cool from September to April (<24oC) for Reef ecosystems to establish and thrive. It was estimated that at Latitude -13.5o , which was the warmest point along the Reef transect, maximum SST occurred in late January to early February (29.64oC ±PI 1.12oC ), the minimum occurred in mid-August (24.26oC ±PI 1.47oC), SST increased to mid-November (27.96oC ±PI 1.1oC) after which the cycle repeats. The interannual range was therefore about 5.4oC. Despite trend in sea-surface temperature being touted as a threatening process that may ‘catastrophically’ impact on the long-term health and survival of the Reef, of the scores of sampling sites operated by AIMS, only several are dispersed towards the extremities of the Reef, while too few are sufficiently well maintained and serviced to provide reliable long-term data.

Sea surface temperatures reported by AIMS are no warmer than they were in November and December 150 years ago in 1871. As solar radiation increases in summer, SST north of Latitude -13.5o is cooled by the monsoon and remains in the range of 29oC to 30oC. AIMS SST data shows no evidence that the process has broken-down or is likely to break down in the future.

As SST has not changed, nor is it likely to change in the future, coral bleaching is due to something else.

Find out more

The page you have just read is the basic cover story for the full paper. If you are stimulated to find out more, please link through to the full paper – a scientific Report in downloadable pdf format. This Report contains far more detail including photographs, diagrams, graphs and data and will make compelling reading for those truly interested in the issue.

Click here for the Full Report with analysis, graphs, tables and photos

[1] Former NSW Department of Natural Resources research scientist.

[2] https://www.gbrmpa.gov.au/our-work/threats-to-the-reef/climate-change/sea-temperature

Ocean surface temperature limit

Guest post

Richard Willoughby[1]

http://www.bomwatch.com.au/

contact: scientist@bomwatch.com.au

Main points

  • Observations for at least the last 50 years of open ocean surface temperature provide clear evidence that the annual average ocean surface temperature is limited to 30 degrees Celsius with short-lived excursion up to 32 degrees Celsius.  This observation contradicts the predictions of climate models that show tropical ocean surface temperature perpetually rising.
  • The formation of clouds in response to the surface temperature of tropical oceans limits the surface insolation.  Once the surface temperature reaches 32C the cloud becomes sufficiently persistent that surface heat input and heat output reach a balance.  The consequence being that 32C is the maximum possible temperature of open ocean water. 
  • The ocean surface temperature limiting mechanism is tightly linked to the atmospheric water content.  Once the atmospheric water content reaches an equivalent depth of 45mm, a process of cyclic deep convection sets in whereby water vapour is literally catapulted as high as 12,000 metres into the atmosphere by convective instability.  This is a well-defined physical process detailed in the paper.
  • The paper challenges the concept of “Greenhouse Effect” where radiating gasses such as water vapour is assumed to only cause surface heating.  The key failure with climate models is the parameterising of clouds which are, in fact, formed from different phases of atmospheric water.  Once the atmospheric water reaches 45mm, the mode change to cyclic cloudburst results in the atmospheric water becoming a cooling agent rather than a warming agent at lower level.

Background

The satellite era has provided abundant data with broad coverage of the global energy balance, atmospheric conditions and surface temperature.  Observation of the ocean surface temperature data from satellites provides compelling evidence that the ocean surface temperature rarely exceeds 30 degrees Celsius.  Rare exceptions like the Persian Gulf, which reaches up to 35 degrees Celsius, provides the key to identifying that cyclic cloudburst is a surface temperature limiting process.  Cloudburst is rare in the Persian Gulf and it is the only sub-tropical ocean surface exceeding 28 degrees Celsius that has not experienced a tropical cyclone in recorded history.

What we did

In addition to the satellite data, surface level data from the tropical ocean moored buoy arrays was evaluated to observe the surface temperature limiting process in operation through one hour intervals displaying the exquisite precision of this natural atmospheric-ocean system.  A series of charts within the paper demonstrates the same process across the three tropical oceans separated by thousands of kilometres and at different times of the year all regulating ocean surface temperature to a limit of 30 degrees Celsius.

A single column atmospheric model was developed through the course of this study to quantify convective instability and that led to the understanding that the increasing persistency of high level cloud reduced surface insolation by increasing cloud short wave reflection.  Clear sky conditions reduce rapidly with surface temperature above 28 degrees Celsius.

Detailed analysis, month-by-month of top of the atmosphere radiation balance and the level of atmospheric water unearthed a key parameter that the role of water vapour pivots about a level of 45mm.  Below that level, the water vapour is a warming agent through long-wave radiation absorption while above that level it is a cooling agent through the process of convective instability dominating cloud formation and increased cloud short-wave radiation reflection.

Principal findings

  • Current climate models assume the ocean surface temperature can continue to increase without constraint.  Clouds in climate models are parameterised and their formation is not tightly linked to surface temperature.  These fundament flaws mean climate models predict physically impossible outcomes.  They are not representative of Earth’s climate system.  The warming trend all climate models predict for the Nino34 region is clearly not evident in the actual recorded data over the last four decades.
  • Until climate models can replicate the physics of deep convection, tightly linked to surface temperature rather than the naive parameterisation of clouds, they will remain nothing more than extended weather models with useful predictive ability of a few days.
  • The behaviour of water in Earth’s atmosphere follows clearly defined processes that depend on the physical properties of water, in all phases, and atmospheric pressure.  The only way the open ocean surface temperature can exceed 32C is through a substantial increase in atmospheric pressure.  There is strong proxy evidence that higher ocean surface temperature were recorded in the Cretaceous period when the atmospheric pressure was approximately 10% higher than present time.  This is consistent with the temperature limiting process detailed in the paper.
  • Observations of the attributes of water in the atmosphere contradict the heat trapping assumption of atmospheric water described by the “Greenhouse Effect”.  Water in the atmosphere is not heat trapping but rather a temperature regulating component that increases radiating power (the sum of reflected short wave radiation and emitted long wave radiation) when the surface warms and reduces radiating power when the surface cools through reduced cloud cover enabling more surface insolation. 

An important link – find out more

The page you have just read is the basic cover story for the full paper. If you are stimulated to find out more, please link through to the full paper – a scientific Report in downloadable pdf format. This Report contains far more detail including photographs, diagrams, graphs and data and will make compelling reading for those truly interested in the issue.

Click here to download the Full Paper including photos graphs and tables


[1] Professional Electric Engineer consulting in engineering risk for major projects with an enduring interest in natural catastrophes and changing climate.

Duty of Scientists

by David Mason-Jones

At what point does it become the moral and legal duty for scientists to speak out when an issue involving the integrity of science arises?  This challenge has always existed but may be presenting itself in in a new light over the issue of whether sea surface temperatures near the Great Barrier Reef are rapidly rising.

It was this challenging question that came strongly to mind when I was made aware of the two graphs shown below. The first graph is of the raw data from a sensor at the Australian Institute of Marine Science (AIMS) wharf at Cape Ferguson, not far from Townsville, Queensland. To the naked eye, and on an expanded scale, it definitely fails to show any rapid rise over the 29.5 years of observations.

Source: National Tidal Centre. Bureau of Meteorology. 07 May 2021. Australia

Using basic statistical methods, if one digs deeper into the table of data supporting the graph the answer comes back the same – ‘No.’

After reviewing the Cape Ferguson data, natural resources research scientist Bill Johnston found a connection between sea surface temperature measured by the tide gauge and maximum temperature measured on-land but no evidence of a trend uniquely due to warming of ocean waters in the vicinity of Cape Ferguson.  

‘If the numbers at Cape Ferguson are supposed to constitute part of the evidence for rapidly increasing sea surface temperatures in the vicinity of the GBR, they just don’t stack up,’ says Dr Johnston. ‘If a rapid rise exists, we are going to have to look much further afield for the compelling evidence than just a wharf near the shore of the mainland.

‘And if we go looking for the real evidence, we are going to have to find some obvious and sustained increases elsewhere in the Reef and its lagoon to compensate for the absence of an ocean-related trend at Cape Ferguson,’ he says.

The second graph shows Johnston’s work in ‘de-seasoning’ the annual swings in measured temperature due to the difference in the Sun’s apparent position north and south of the Equator. When the sun appears to be directly overhead, it is hotter, the days are longer and the water near the surface is warmer. When the angle of the Earth’s tilt makes the Sun appear to move north of the Equator, the reverse is the case – less solar heat, shorter days and cooler water. The annual swing in sea surface temperature is constant and not attributable in any way to changes in the climate. 

Source: Scientist Dr. Bill Johnston

Dr Johnston’s analysis of the de-seasoned data shows two clusters of warmer temperature (1998 and 2018) but no indication that sea surface temperatures are increasing rapidly or likely to increase in the future.   

The commonly held view that sea temperatures are rising in the GBR is widespread and the message is deeply entrenched, so much so that the topic is an almost guaranteed dinner-party-wrecker if seriously disputed by any of the guests.  

But is it true?

The problem for our dinner party is that, like it or not, a clear-headed review of the observed sea surface temperatures in the GBR shows no rising trend in the data – at least not at Cape Ferguson. Most importantly, there is no such phenomenon in the data that would justify the use of the word ‘rapidly’.

So what is the duty of an ethical scientist at the dinner party in this situation – to wreck the party or just to stay quiet and avoid rocking the boat? What is the scientist’s obligation to draw people’s attention to the discrepancy between belief and reality? This is possibly one of the oldest challenges in science.

‘At Cape Ferguson, there is a huge disparity between what people – and scientists – seem to believe and what the data says,’ says Johnston. ‘True scientists should not sit back and allow this misconception to take hold in the public mind as the truth.’

While Cape Ferguson is a single instance, other sites around the GBR show the same inconvenient result. The AIMS site at Thursday Island, off the tip of Cape York (May 1998 to February 2019); Arlington Reef off Cairns (April 1996 to February 2020); Seaforth Island off Proserpine (July 2005 to February 2021) and Square Rocks off Yepoon show no discernible warming trend. It seems to be the truth that over-hyped talk of rapid rise in sea surface temperature is belief-based, not fact based.   

Someone of influence and repute needs to start blowing the whistle on this.   

The data for Cape Ferguson is available from the Australian Bureau of Meteorology (BOM) website ( http://www.bom.gov.au/oceanography/projects/abslmp/data/monthly.shtml ). The site is one of National Tide Centre’s Australian Baseline Sea Level Monitoring Project (ABSLMP), a unit within BOM. ABSLM monitors seal level and sea surface temperatures at 16 sites around Australia and data can be viewed as PDF graphs and as tables. Please have a look for yourself. I stress this request, please look for yourself and don’t just take my word for it. You just may be shocked by the disparity between the general belief and the reality revealed by the data. Please also bear in mind that the data you will find is not the work of some hair-brained contrarian sitting at a computer late at night, blogging away madly and making it all up. It is the data from the Australian Baseline Sea Level Monitoring Project (ABSLMP).

I will deal with more of this data in greater detail in subsequent articles to be published on http://www.bomwatch.com.au   

For the moment however, let me just focus on the Cape Ferguson site at the AIMS wharf which is part of the baseline monitoring program referred to above. While AIMS is not directly responsible for the collection of the data (it is done automatically) the sensor is co-located at its property and, given the marine science role of AIMS, one might expect that the organisation might have more than a passing interest in the integrity of the Cape Ferguson data.

It’s all a bit disheartening. Very few individuals appear ready to acknowledge that they may be under a moral or legal obligation to speak out about the chasm between belief and empirical data when it comes to sea surface temperatures near the Reef.   

There is a further question that opens out from this. At what point do we expand the idea of a personal moral or legal duty of an individual to the wider scope of the legal duty of a corporate entity such as a university or publicly funded research organisation? Not only is it intolerable that individual scientists may avoid their moral and legal duty, it is also intolerable when a corporate entity does the same.

Research organisations we have come to trust cannot be granted the luxury of legal immunity when they make claims that cannot be substantiated. They cannot choose to remain silent when challenged by obvious discrepancies.     

I opened this essay by posing the question about when a scientist’s personal moral or legal duty to speak-out clicks in. The disheartening thing is that this point of law is not yet clearly determined and the law seems more porous on this subject than it does in, say, the commercial world where an individual makes a false or misleading statement about the contents of a prospectus when promoting that prospectus. Similarly, a company – a corporate legal entity – faces severe legal sanction if it issues a false or misleading prospectus.

Let’s hope the persistence of scientists like Dr Bill Johnston gives heart to others to speak out when they see instances like Cape Ferguson. Our systems of quality control in science need teeth, not more funding for flawed science based on foundations of wrong, or shaky, data.         

<end notes>

David Mason-Jones is a freelance journalist of many years’ experience. He has researched and written extensively on environmental issues. www.journalist.com.au or  publisher@bomwatch.com.au

Dr Bill Johnston is a former NSW Department of Natural Resources senior research scientist and former weather observer. scientist@bomwatch.com.au

To view the graphs and tables of the ABSLMP data in full visit http://www.bom.gov.au/oceanography/projects/abslmp/data/monthly.shtml  

For more information about climate of the GBR visit http://www.bomwatch.com.au