Note: If you want to link directly to the Full Paper supporting this Brief Summary, click here. The Full Paper is a PDF of 30 pages and includes extensive analysis including more detailed discussion, tables of raw data used, additional photos, graphs of data from Charleville and the other ‘nearby’ weather stations which the BOM used to homogenise the poor state of the Charleville data.
If you would prefer to read this Brief Summary first, then a link to the Full Paper is provided at the end of this Summary.
Are Australia’s automatic weather stations any good?
Part 4: Effect on temperature extremes
Dr. Bill Johnston[1]
scientist@bomwatch.com.au
Main points
- There is no change in the climate at Charleville or the ten other sites that were used to homogenise maximum temperature at Charleville in 1996.
- For the people of central Queensland, save for a sudden shift in the subtropical ridge such as happened in November 1924, the climate they have is the climate they will experience for the foreseeable future. Droughts will come and go every 9 to 12 years but they are not increasing in severity or frequency. Their effects are just more visible from space, on the evening news and on social media.
- It is also no warmer in Central Queensland than it has been in the past. Conflating the use of rapid-sampling automatic weather station (AWS) probes housed in infrequently serviced 60-litre Stevenson screens under adverse conditions with “the climate” is misleading in the extreme.
- Using faulty (correlated) data to correct faults in Australian Climate Observations Reference Network – Surface Air Temperature (ACORN-SAT) data has no scientific or statistical merit and should be abandoned.
- There is no end to the damage that the Bureau’s infrequently maintained AWS network and biased homogenisation methods can inflict on Australia’s economy and our national prosperity. With trust in our institutions at an all-time low, an open inquiry is long overdue.
Background
The United States Army Air Force (USAAF) used the aerodrome at Charleville in southwestern Queensland as a heavy bomber transit base during World War II. The operational precinct, including the original QANTAS hanger, the tower, meteorological (met) office, refuelling and other facilities were located south of Warrego Highway near the town racecourse (Figure 1).
Astonishingly, although Charleville is one of 112 ‘high quality’ Australian Climate Observations Reference Network – Surface Air Temperature (ACORN-SAT) sites used to monitor long term temperature trends, the Bureau of Meteorology (BoM) did not know where their original office was or that the instrument enclosure and cloud-base searchlight was located 160 m southwest at Latitude ‑26.4103o, Longitude 146.2561o.
Assertions that “The Bureau’s methods have been extensively peer-reviewed and found to be among the best in the world”; and that “the community can have confidence the Bureau is providing an accurate estimate of Australia’s true temperature trend” are demonstrably not true. In 2011, ‘World-leading, expert’ peer reviewers did not evaluate the integrity of metadata used to make adjustments to ACORN-SAT data or investigate the soundness of individual datasets. BoM has also misrepresented the usefulness of temperatures observed under variable conditions using a range of instruments at different locations, to accurately measure trend and changes in the climate.
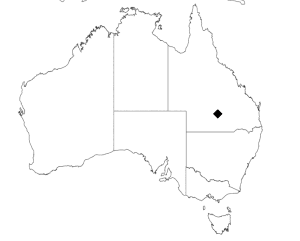
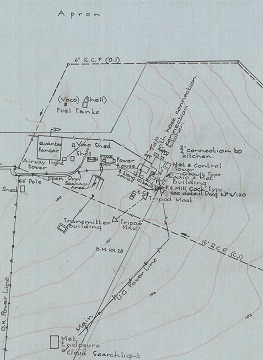
Figure 1. Located in central Queensland (top image), the Charleville aerodrome was used by the USAAF as a heavy bomber transit base during WWII. Facilities including the control tower, radio-met office and met enclosure were located in the northwestern sector of the aerodrome adjacent to the heavy-duty E-W runway (right; section of the plan from the National Archives of Australia (Item ID, 1972125) shown in Appendix 1 of the accompanying report).
About the data for Charleville airport.
From 1943 to 1956 when Bureau staff moved from the Aeradio office to the Department of Civil Aviation Flight Services Unit (FSU) near the terminal and they moved the site about 580 m southeast; ‘raw’ daily maximum temperature data was made-up. Metadata seems deliberately vague about what went on, where the data came from and the process they used to fill the 13-year gap. As if to re-write the climate history of central Queensland, data-reconstruction diminished the impact of the long-running inter-War drought on temperature extremes, particularly during the most devastating years to 1947.
In September 1990 the site moved 150 m nearer the runway where temperature was measured by a Micromac automatic weather station that only reported hourly data. There is some confusion about when a 60-litre screen was installed or whether the 230-litre screen was used by a replacement AWS before it became the primary instrument on 1 November 1996. It appears that in lieu of manual data, which may not have been digitised and despite its shortcomings, BoM relied on the Micromac AWS for reporting daily maxima and minima (Tmax and Tmin) until 1996. The site moved about 600 m west to its present position in October 2003 (Figure 2), which was when the previous 230-litre screen was decommissioned.
Site and instrument comparisons.
The BoM seems to have gone to extraordinary lengths to obstruct instrument (thermometers vs. AWS and 230-litre vs. 60-litre screens) and inter-site comparisons. Aerial photographs show the FSU-site was operational at least until 13 January 1992 and that an instrument was located near the Micromac site possibly as early as 1963; however there is no overlapping data for the 1990 move. There is also no data that allows different screens to be compared after 8 December 1999, when the 60-litre screen was installed until the site moved on 13 September 2003 and the 230-litre screen was decommissioned. Furthermore, the site diagram for Charleville Aero (44021) dated 28 May 2002 (before the move) only shows one screen, while despite being the same site, the plan for Charleville Aero Comparison (given the new ID, 44221) dated 7 May 2005 only shows a single large screen even though it had been decommissioned 2-years earlier!
Occurrence of temperature extremes.
Analysis shows there was no change in the real climate at Charleville. Despite this, the distribution of upper-range values (temperatures greater than the 95th day-of-year percentiles) was distorted (skewed higher) by the AWS and 60-litre screen. Pre- and post-2013 percentile differences showed the AWS most likely exceeded its calibrated range to peak 2.1oC above pre-2013 percentiles and to avoid unrealistic numbers of observations exceeding the old century benchmark of 37.8oC (100oF), values greater than 86th percentile (35.7oC) were most likely culled or moderated in situ or by post-acquisition processing before being logged.
Homogenisation is fatally flawed.
Headed by a case study of data for Mungindi Post Office, the ten sites used by BoM to homogenise Charleville Tmax for a change in 1996 (probably related to a new AWS replacing the Micromac before becoming the primary instrument on 1 November) were also analysed.
Using highly correlated comparator datasets to make adjustments is fatally flawed. Data for Mungindi and the nine other mostly manual datasets owed their correlation with Charleville to embedded parallel faults – alignment of screen and site changes, site moves, watering, the change to the AWS and small screen at Longreach. Like for Charleville, unbiased analysis found no trend or change at any sites that was attributable to the climate.
Using faulty (correlated) data to correct faults in ACORN-SAT data has no scientific or statistical merit and should be abandoned.
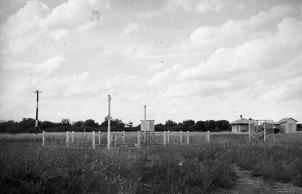
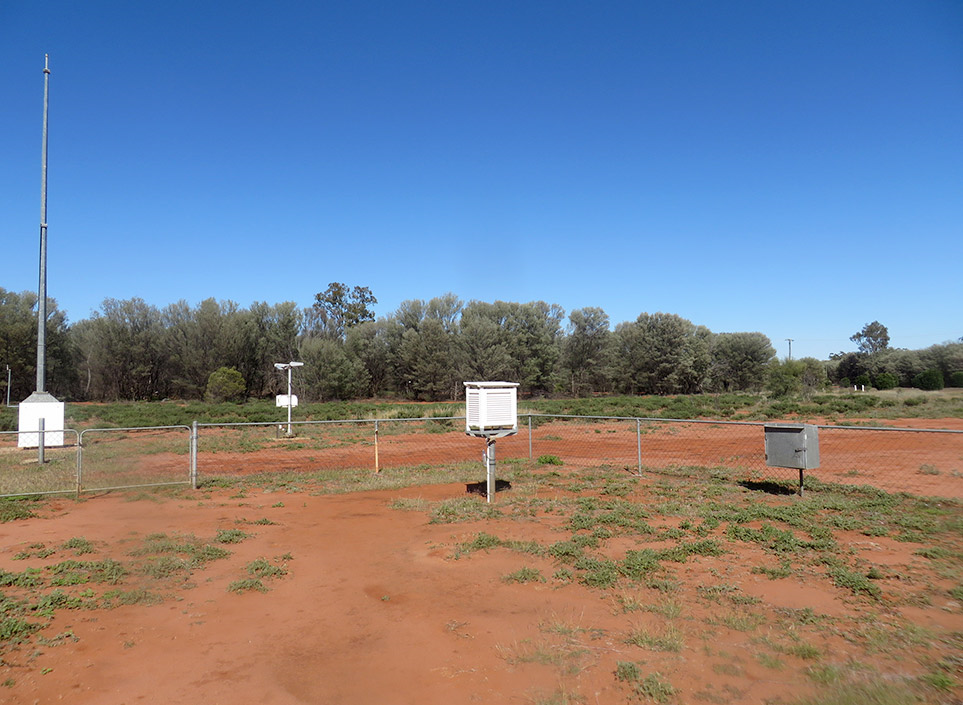
Figure 2. The Charleville Airport met-enclosure and 230-litre Stevenson screen photographed in 1954 (top image). The structure to the right protected the cloud-base searchlight. Buildings in the distance included the powerhouse, balloon-filling shed and Aeradio office. Although the original screen was oriented to the north (not to the south, which is the standard) the contrast between the grassy WW-II site and the red bare-soil at the current site (lower image) is stark. The current 60-litre Stevenson screen houses temperature probes for the rapid-sampling automatic weather station. Transient air-pockets rising from dry bare surfaces, which during the heat of the day may reach temperatures of >60oC, result in temperature spikes that are unlikely to represent the ‘true’ temperature of the local climate. (Photographs courtesy of the Airways Museum and BoM.)
Implications
The Bureau’s temperature datasets are used widely to inform, discuss, develop/support policy and shape public opinion as well as for a wide range of scientific studies related to the climate and the biosphere more generally. Scores, if not hundreds of peer-reviewed scientific papers published in top-shelf journals over the past few decades are predicated on the notions that (i), data relied upon truly reflect the climate; (ii), data are fit for purpose – that conditions under which measurements were made were not biased by site changes and that data were carefully curated; and (iii), methods used by the Bureau for quality control including for homogenisation are transparent and replicable across multiple sites, datasets and regions.
However, none of the underlying assumptions has been found to be true. While all sites thus far examined by BomWatch have changed and moved in ways that affect data, no datasets show trend or change that could be unambiguously attributed to the climate. Metadata is universally inexact and misleading. That pre-1956 data at Charleville were made-up and that for Bollon and Injune were probably in-filled or estimated for several years data, undermines claims that the Bureau’s data handling methods are amongst the best in the world.
- That homogenisation uses highly correlated neighbours that embed parallel faults to adjust ACORN-SAT data used by CSIRO in State of the Climate Reports to justify and inform policy; which in-turn is unquestionably reported-on by activist organisations and media such as the Climate Council, WWF, The Conversation, the ABC and The guardian is a scientific travesty of monumental proportions. Further, it is the Bureau that bears the responsibility.
- That users of the Bureau’s data including professors and students at Australian universities have failed to check soundness of the data they use, seriously undermines their credibility and the standing of the institutions they represent. The multiple failures of down-stream peer review are endemic and beyond redemption.
- Finally, failure to undertake due diligence by those purporting to be ‘battling’ climate change like the Great Barrier Reef Foundation, Farmers for Climate Action, the Murray-Darling Basin Authority, banks like ANZ, corporates such as QANTAS and BHP, lobbyists for the electricity industry, committees advising ministers, the Australian Research Council, CSIRO and academies of sciences, fuels widespread distain for elitist institutions and entities whose trustworthiness is questionable.
There is no end to the damage that the Bureau’s data and data handling methods can inflict on Australia’s economy, our children’s future prospects and our national prosperity.
14 February 2021
[1] Former NSW Department of Natural Resources senior research scientist and former weather observer.
An important link – find out more
The page you have just read is the basic cover story for the full paper. If you are stimulated to find out more, please link through to the full paper – a scientific Report in downloadable pdf format. This Report contains far more detail including photographs, diagrams, graphs and data and will make compelling reading for those truly interested in the issue.
To read the Full Paper supporting this Brief Summary, click here.
Hi Bill
Why no mention of the Charleville Post Office official station which ran from about 1875 to 1959 and is only about a km west of the airport?
Regards
Ian Beale
Thanks Ian,
Yes I also looked closely at Charleville PO. The original building was torn down and replaced in 1908. That post office was substantially changed in 1941 to accommodate the telephone exchange. I believe the Stevenson screen moved, possibly to the Post Masters residence probably in 1942.
The new location was about 0.5 DegC cooler which leads me to think the environs were watered.
So either way (the airport or PO) we still miss out on reliable temperature data during the height of the inter-War drought.
Adjusting for changes in 1913 and 1942 and rainfall, left no residual trend attributable to the climate.
Cheers,
Bill Johnston