Category Archives: Bureau of Meteorology

3. Meekatharra, WA

Is homogenisation of Australian temperature data any good?

Dr Bill Johnston[1]

scientist@bomwatch.com.au

The ACORN-SAT project is deeply flawed, unscientific and should be abandoned.

Read on …   

Situated 500 km east from Shark Bay, south of the Gibson Desert and adjacent to the Great Victoria Desert, Meekatharra is a hot, dry isolated outback town in mid-west Western Australia. Famously referred to as the end of the earth by Australia’s former Prime Minister, Malcolm Fraser when his aircraft was diverted from Perth in 1977 due to inclement weather, Meekatharra is now the epicentre of a mining boom and the airport serves as a hub for fly-in fly-out workers and a base for the Royal Flying Doctor Service (RFDS).

Constructed as an all-weather ‘bare-base’ aerodrome with long, sealed runways in 1943, linking Perth, the secret bomber base at Corunna Downs near Marble Bar, and Darwin, Meekatharra was one of only a few aerodromes in outback WA capable of handling heavy bombers. It was relinquished by the RAAF to the Department of Civil Aviation as a Commonwealth airport after 1946, and ownership transferred to the Shire of Meekatharra in 1993.

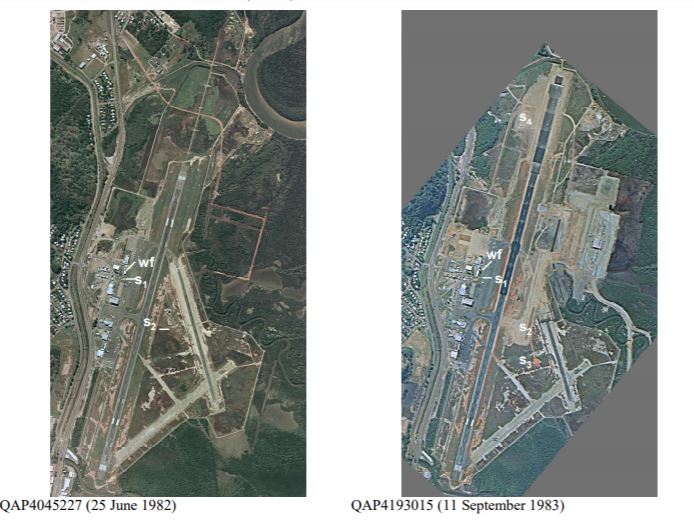
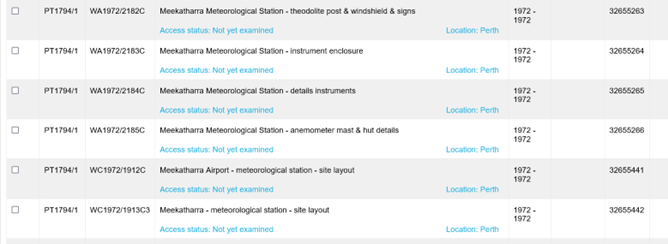
Weather observations commenced at the post office on the corner of Main and High streets Meekatharra in January 1926, having previously been reported from Peak Hill, about 110 km to the NW from 1898. Observations transferred to the former RAAF Aeradio office in 1950, and according to ACORN-SAT metadata, the site moved to a new meteorological office (MO) in about 1975 (Figure 1). However, files held by the National Archives of Australia (NAA) show that before the office was built in 1974, an instrument enclosure, instruments, a theodolite post and wind shield used in launching weather balloons were installed near the proposed new office in 1972 (Figure 2). The overlap with data from the previous Aeradio site, which continued to be used at least until staff relocated, probably in 1975 (Figure 3), was apparently used to smooth the transition to the new site.

ACORN-SAT

Meekatharra is one of 112 Australian Climate Observations Reference Network – Surface Air Temperature (ACORN-SAT) sites used by the Bureau of Meteorology, CSIRO, state governments, WWF and the Climate Council, to convince themselves, kiddies for climate action, and everyone else that the climate is warming irrevocably due to CO2.

Combined with dodgy measurement practices, data homogenisation is used at Meekatharra to create warming in maximum temperature (Tmax) data that is unrelated to the climate. Adjusting for a change in 1934 that was not significant, ignoring that the Aeradio site was watered, and that a period of overlap from 1972 was used to smooth the move to the MO site, allegedly in about 1975, for which no adjustment was made, created trends in homogenised data that were unrelated to the climate. Furthermore, data for the total of 18 sites used to homogenise Meekatharra Tmax, were not homogeneous.

The assertion that ACORN-SAT sites have been carefully and thoroughly researched, and that comparator reference sites selected on the basis of inter-site correlations would be broadly homogeneous around the time site changes occurred is demonstrably untrue. From multiple perspectives, the underlying proposition that series derived from up to 10 reference stations could provide a “high level of robustness against undetected inhomogeneities” is not supported.

As no change in the climate is detectable across the nineteen datasets examined, including Meekatharra, and the methodology is unscientific and deeply flawed, the ACORN-SAT project should be abandoned.

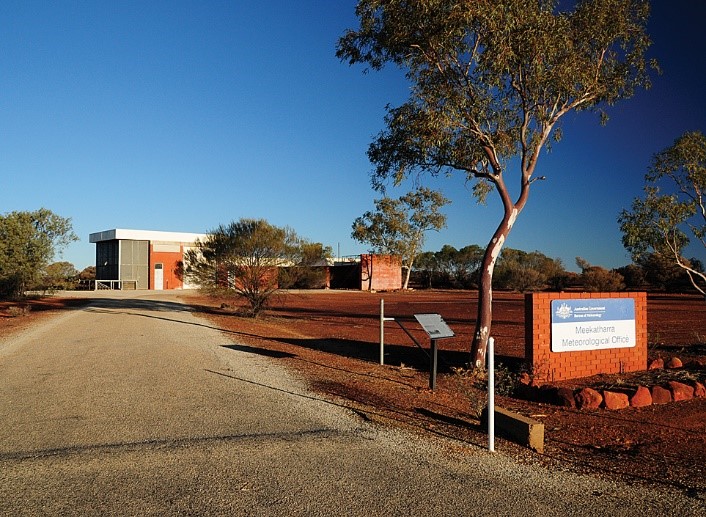
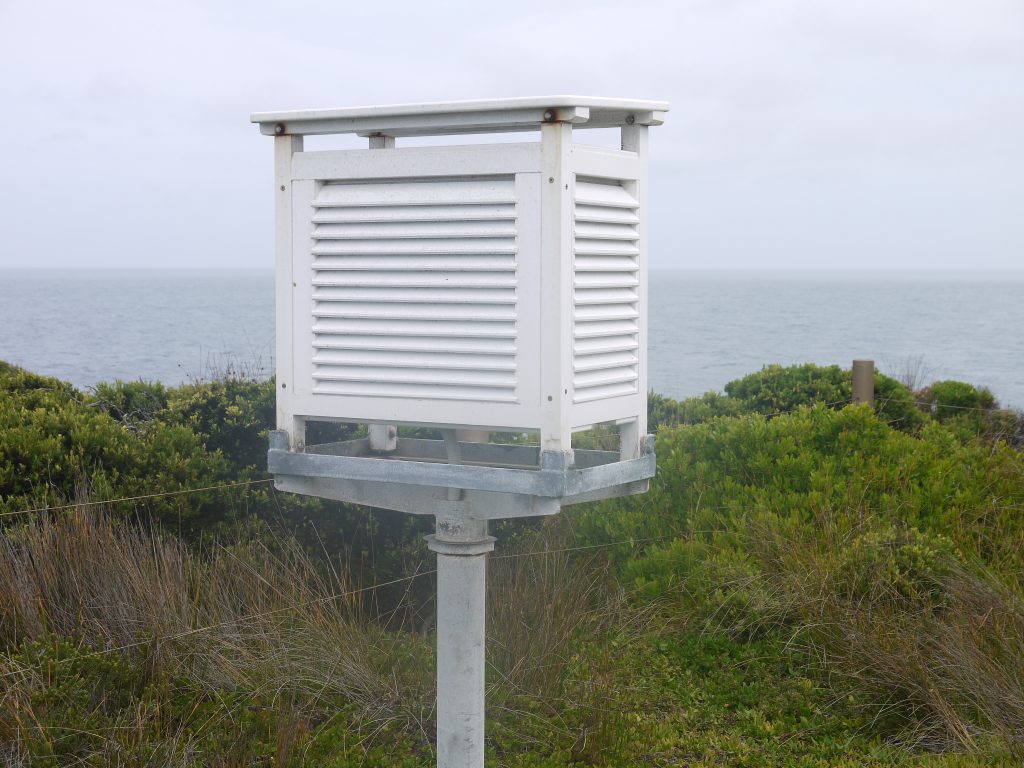
Figure 1. The Meekatharra meteorological office in August 2010 (from the ACORN-SAT Catalogue).

Figure 2. A screenshot of files held by the National Archives of Australia relating to the new 1972 instrument enclosure at Meekatharra (Search term Meekatharra meteorological).

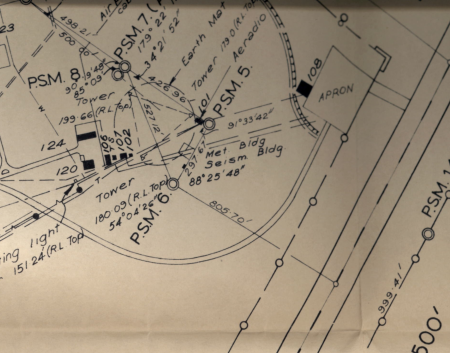
Figure 3. Building plan in 1971 showing the RFDS hanger (108), Aeradio and met-office (101), the fenced enclosure southwest of the office including met (H2) and seismograph huts, towers suspending the aerial array and earth-mat, workshop (102), fuel bowser (107), power plant (106), and workshop and equipment buildings (120 and 124).       


An important link – find out more

The page you have just read is the basic cover story for the full paper. If you are stimulated to find out more, please link through to the full paper – a scientific Report in downloadable pdf format. This Report contains far more detail including photographs, diagrams, graphs and data and will make compelling reading for those truly interested in the issue.

Click here to download the full paper with photos graphs and data.

Note: Line numbers are provided in the linked Report for the convenience of fact checkers and others wishing to provide comment. If these comments are of a highly technical nature, relating to precise Bomwatch protocols and statistical procedures, it is requested that you email Dr Bill Johnston directly at scientist@bomwatch.com.au referring to the line number relevant to your comment.   

[1] Former NSW Department of Natural Resources research scientist and weather observer.

About

Welcome to BomWatch.com.au a site dedicated to examining Australia’s Bureau of Meteorology, climate science and the climate of Australia. The site presents a straight-down-the-line understanding of climate (and sea level) data and objective and dispassionate analysis of claims and counter-claims about trend and change.

BomWatch delves deeply into the way in which data has been collected, the equipment that has been used, the standard of site maintenance and the effect of site changes and moves.

Dr. Bill Johnston is a former senior research scientist with the NSW Department of Natural Resources (abolished in April 2007); which in previous guises included the Soil Conservation Service of NSW; the NSW Water Conservation and Irrigation Commission; NSW Department of Planning and Department of Lands. Like other NSW natural resource agencies that conducted research as a core activity including NSW Agriculture and the National Parks and Wildlife Service, research services were mostly disbanded or dispersed to the university sector from about 2005.

BomWatch.com.au is dedicated to analysing climate statistics to the highest standard of statistical analysis

Daily weather observations undertaken by staff at the Soil Conservation Service’s six research centres at Wagga Wagga, Cowra, Wellington, Scone, Gunnedah and Inverell were reported to the Bureau of Meteorology. Bill’s main fields of interest have been agronomy, soil science, hydrology (catchment processes) and descriptive climatology and he has maintained a keen interest in the history of weather stations and climate data. Bill gained a Batchelor of Science in Agriculture from the University of New England in 1971, Master of Science from Macquarie University in 1985 and Doctor of Philosophy from the University of Western Sydney in 2002 and he is a member of the Australian Meteorological and Oceanographic Society (AMOS).

Bill receives no grants or financial support or incentives from any source.

BomWatch accesses raw data from archives in Australia so that the most authentic original source-information can be used in our analysis.

How BomWatch operates

BomWatch is not intended to be a blog per se, but rather a repository for analyses and downloadable reports relating to specific datasets or issues, which will be posted irregularly so they are available in the public domain and can be referenced to the site. Issues of clarification, suggestions or additional insights will be welcome.   

The areas of greatest concern are:

  • Questions about data quality and data homogenisation (is data fit for purpose?)
  • Issues related to metadata (is metadata accurate?)
  • Whether stories about datasets consistent and justified (are previous claims and analyses replicable?)

Some basic principles

Much is said about the so-called scientific method of acquiring knowledge by experimentation, deduction and testing hypothesis using empirical data. According to Wikipedia the scientific method involves careful observation, rigorous scepticism about what is observed … formulating hypothesis … testing and refinement etc. (see https://en.wikipedia.org/wiki/Scientific_method).

The problem for climate scientists is that data were not collected at the outset for measuring trends and changes, but rather to satisfy other needs and interests of the time. For instance, temperature, rainfall and relative humidity were initially observed to describe and classify local weather. The state of the tide was important for avoiding in-port hazards and risks and for navigation – ships would leave port on a falling tide for example. Surface air-pressure forecasted wind strength and direction and warned of atmospheric disturbances; while at airports, temperature and relative humidity critically affected aircraft performance on takeoff and landing.

Commencing in the early 1990s the ‘experiment’, which aimed to detect trends and changes in the climate, has been bolted-on to datasets that may not be fit for purpose. Further, many scientists have no first-hand experience of how data were observed and other nuances that might affect their interpretation. Also since about 2015, various data arrive every 10 or 30 minutes on spreadsheets, to newsrooms and television feeds largely without human intervention – there is no backup paper record and no way to certify those numbers accurately portray what is going-on.

For historic datasets, present-day climate scientists had no input into the design of the experiment from which their data are drawn and in most cases information about the state of the instruments and conditions that affected observations are obscure.

Finally, climate time-series represent a special class of data for which usual statistical routines may not be valid. For instance, if data are not free of effects such as site and instrument changes, naïvely determined trend might be spuriously attributed to the climate when in fact it results from inadequate control of the data-generating process: the site may have deteriorated for example or ‘trend’ may be due to construction of a road or building nearby. It is a significant problem that site-change impacts are confounded with the variable of interest (i.e. there are potentially two signals, one overlaid on the other).

What is an investigation and what constitutes proof?

 The objective approach to investigating a problem is to challenge the straw-horse argument that there is NO change, NO link between variables, NO trend; everything is the same. In other words, test the hypothesis that data consist of random numbers or as is the case in a court of law, the person in the dock is unrelated to the crime. The task of an investigator is to open-handedly test that case. Statistically called a NULL hypothesis, the question is evaluated using probability theory, essentially: what is the probability that the NULL hypothesis is true?

In law a person is innocent until proven guilty and a jury holding a majority view of the available evidence decides ‘proof’. However, as evidence may be incomplete, contaminated or contested the person is not necessarily totally innocent –he or she is simply not guilty.

In a similar vein, statistical proof is based on the probability that data don’t fit a mathematical construct that would be the case if the NULL hypothesis were true. As a rule-of-thumb if there is less than (<) a 5% probability (stated as P < 0.05) that that a NULL hypothesis is supported, it is rejected in favour of the alternative. Where the NULL is rejected the alternative is referred to as significant. Thus in most cases ‘significant’ refers to a low P level. For example, if the test for zero-slope finds P is less than 0.05, the NULL is rejected at that probability level, and trend is ‘significant’. In contrast if P >0.05, trend is not different to zero-trend; inferring there is less than 1 in 20 chance that trend (which measures the association between variables) is not due to chance.

Combined with an independent investigative approach BomWatch relies on statistical inference to draw conclusions about data. Thus the concepts briefly outlined above are an important part of the overall theme. 

Using the air photo archives available in Australia, Dr Bill Johnston has carried out accurate and revealing information about how site changes have been made and how these have affected the integrity of the data record.