Part 1: A robust fitness test for maximum temperature data
Dr. Bill Johnston[1]
Synopsis
The first post in this series about the reliability of automatic weather stations (AWS) provides physical justification for using the First Law of thermodynamics as the reference frame against which weather station data may be assessed. While advection warms the air, which increases maximum temperature (Tmax), latent heat removed by evaporation of rainfall is locally cooling. The First Law theorem predicts a dynamic balance between average annual Tmax and annual rainfall, which is evaluated statistically.
Adopting Amberley RAAF as the case study, analysis of Tmax ~ rainfall residuals identified non-rainfall changes that impacted on trend; while statistical significance and variation explained objectively measured overall conformance with the First Law theorem. Analysis of Tmax for six other sites showed the methodology was robust, replicable, widely applicable and therefore useful for benchmarking the operational performance of Australia’s automatic weather station network.
Data are coarse and all sites were poorly documented. Incomplete and misleading metadata, inadequate site control and biased homogenisation methods undermine claims that Australia’s climate has changed or warmed.
Background
With their current focus on climate warming, climate scientists need robust quality assurance methods for verifying that maximum temperature data (Tmax) used for testing hypothesis about the historic and contemporary climate and its possible changeableness going forward are fit for purpose. Although thousands of datasets are potentially accessible not all are equally useful. The question examined in this series of posts about automatic weather stations is: are their data fit for the purpose of determining change or long-term trends; or are they only useful for monitoring day-to-day weather?
The problem
Since the 1990s Australia’s Bureau of Meteorology has all but abandoned its monitoring network. Met-offices like at Ceduna, Oodnadatta, Cobar and Mildura sit empty; some like Hobart and Sydney Observatory have been sold or re-purposed, while others like Coffs Harbour, Albany, Canberra, Tindal and Mount Isa have been demolished and removed. Rapid-sampling platinum resistance probes have replaced thermometers, automatic weather stations have replaced observers and 230-litre Stevenson screens used to house instruments, have been replaced by 60-litre ones with that program accelerating over recent years. Due to their restricted capacity to buffer against transient eddies; the 60-litre screens are likely to be biased-high on warm days (Figure 1).
Sensitive instruments housed in 60-litre screens, which are hard-wired to the Bureau’s computer in Melbourne is a potent source of on-going bias. Neighbouring sites that have changed to AWS more or less in unison used to cross-validate and adjust each other’s data in real-time, reinforces rather than adjusts potential errors and embedded anomalies. Its unlikely for example, that data for any sites are truly independent and it is likely that the combined behaviour of infrequently maintained unmanned sites operating with small screens enhances warming. There are other problems too including the propensity for 1-second observations to report random spikes – flurries of warmer air rising from pavements or created by vehicles or people going past. Of the 86,400 one-second values recorded by an AWS each 24-hours, only two of those carry forward as data – the highest is the maximum for the day and the lowest is the minimum.
Error control using cross validation also requires that neighbouring site data be of acceptable quality and unaffected by parallel non-climate effects, which is impossible to gauge from an office hundreds or thousands of kilometres from the site.
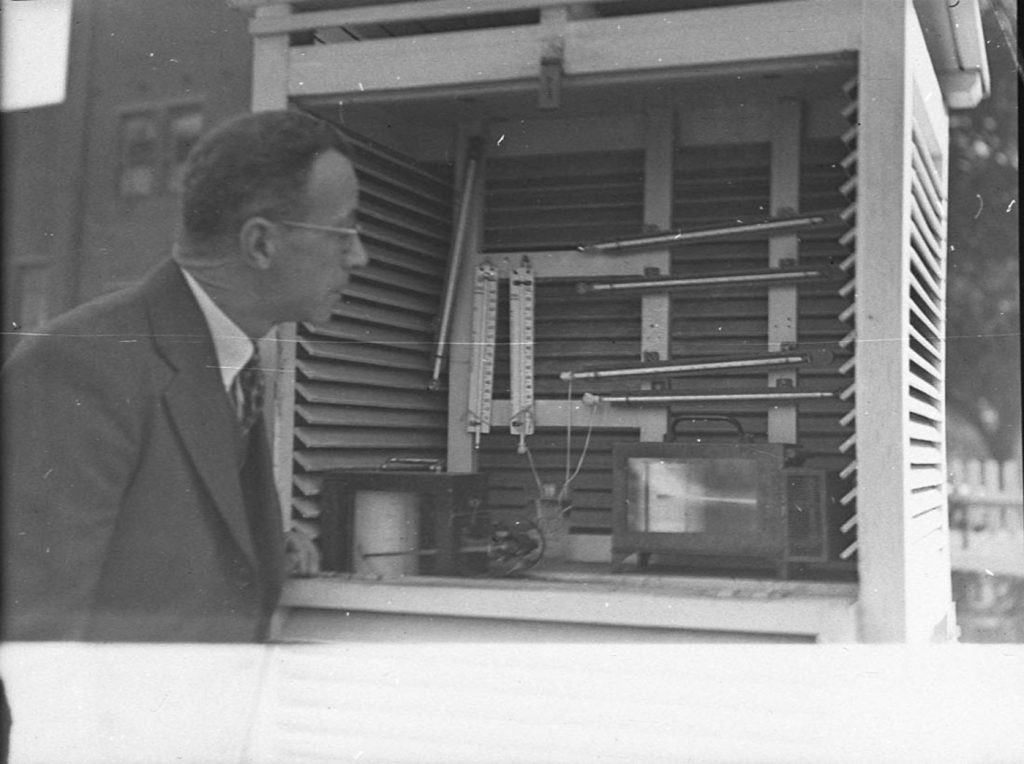
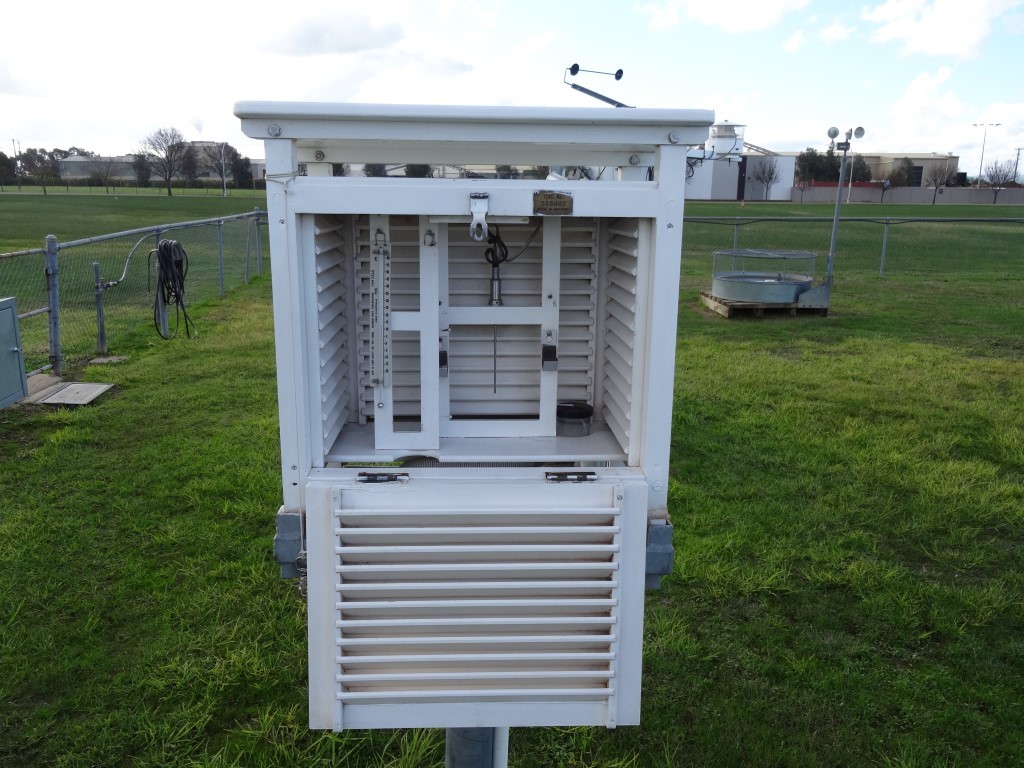
Figure 1. Internal view of the large Stevenson screen at Sydney Observatory in 1947 (Top above, black and white image) and the small screen at Wagga Wagga airport in June 2016 (lower above, colour image). While thermometers in the 230-litre screen are exposed on the same plane, the electronic probe at Wagga Wagga is placed behind the frame about 2 cm closer to the rear of the screen, which faces north to the sun. According to metadata, the 60-litre screen at Wagga Wagga was installed on 10 January 2001 and although thermometers were removed on 28 April 2016 intercomparative data is unavailable.
The burning question is whether data reported by AWS reflect the change in screen size (60-litres vs. 230-litres), behaviour of the electronic instrument (vs. observed thermometers), conversion of electrical resistance to temperature (calibration error), data processing (detection and filtering of erroneous values; averaging; cross-validation); reduced site control and maintenance (grass mowing, cleaning equipment etc.); the climate, or something else.
The First Law Theorem
The First Law of Thermodynamics, which is a universal theorem, is used a reference frame for assessing the fitness of maximum temperature (Tmax) data. Data are expected to behave rationally and not in some random, chaotic way and the methodology outlined in the following posts has been devised to test and evaluate conformance with the theorem. Using Amberley RAAF as a case study, the first paper in this series outlines the physical basis underpinning the approach. Six widely dispersed airport sites were also analysed to replicate and verify that methods are robust and widely applicable. Subsequent posts will evaluate AWS datasets from across Australia and those for sites in the vicinity of capital cities.
As droughts are always hot and dry, and rainy years mild and moist, lack of negative correlation between Tmax and rainfall; low explanatory power (variation explained); confounded signals and weird values – high Tmax in rainy years and vice versa, are causes of concern.
The First Law theorem provides a rational basis for determining if Australia’s automatic weather stations are any good, or if the data they produce consists of incoherent random numbers that bear little relationship to the ‘real’ climate.
An important link – find out more
The page you have just read is the basic cover story for the full paper. If you are stimulated to find out more, please link through to the full paper – a scientific Report in downloadable pdf format. This Report contains far more detail including photographs, diagrams, graphs and data and will make compelling reading for those truly interested in the issue.
Click here to download the full paper including photographs and tables of data
[1] Former Senior Research Scientist. Email: scientistATbomwatch.com.au
With regard to Wagga Wagga, there should be direct comparisons available for Tmax and Tmin, because at Bureau-staffed stations the liquid-in-glass readings were noted and written down at 0900 and 1500. This was done for many years, up until BoM-trained observers were removed as stations were “de-staffed”. Indeed, the place in the A8, the monthly observations book, had the “electronic instruments” section crossed out and “liquid-in-glass” substituted. BoM couldn’t be bothered editing and reprinting the A8 to reflect practices current by the med-teens. From memory the last reprint was in mid 00s. Anyway, I noticed over many years that the probe gave a higher max, by about 0.5-1.0 degrees C, especially in summer, and particularly on cloudless days. The change to smaller screens occurred progressively from the mid-90s. As is visible in the 1947 Wagga shot, the large screens had room for a thermograph and hair hygrograph. I understand there is a switch from wood to plastic screens underway- there are now no observers onsite to clean, maintain and paint Stevenson screens. I wonder too about the measurement of dew point and humidity- with no observers onsite there is no one to keep reservoirs full and muslins changed, so that data would be measured some other way.
I worked across Australia for BoM from 1980-2015, from Norfolk Island to Weipa to Learmonth and including Wagga Wagga late ’85-88. My experiences with measurement of temperature and other data led me to become a “global warming” sceptic, although there are other factors involved in that decision. I am contemptuous of “world temperatures” calculated to two decimal places, for instance.