The ACORN-SAT project is deeply flawed, unscientific and should be abandoned.
Read on …
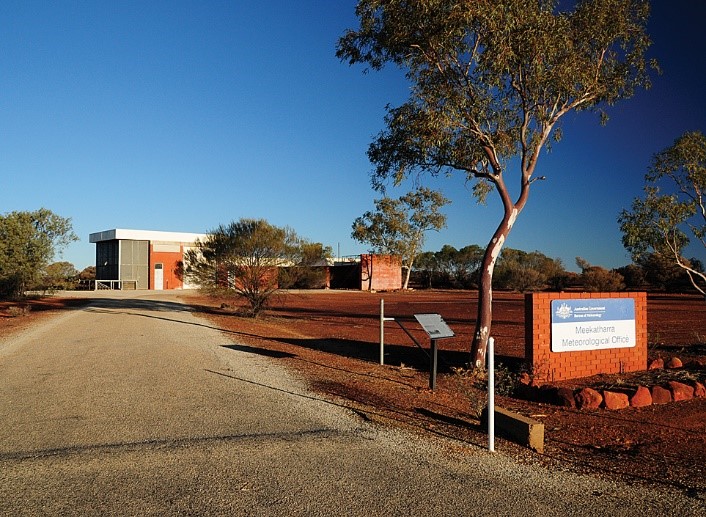
Situated 500 km east from Shark Bay, south of the Gibson Desert and adjacent to the Great Victoria Desert, Meekatharra is a hot, dry isolated outback town in mid-west Western Australia. Famously referred to as the end of the earth by Australia’s former Prime Minister, Malcolm Fraser when his aircraft was diverted from Perth in 1977 due to inclement weather, Meekatharra is now the epicentre of a mining boom and the airport serves as a hub for fly-in fly-out workers and a base for the Royal Flying Doctor Service (RFDS).
Constructed as an all-weather ‘bare-base’ aerodrome with long, sealed runways in 1943, linking Perth, the secret bomber base at Corunna Downs near Marble Bar, and Darwin, Meekatharra was one of only a few aerodromes in outback WA capable of handling heavy bombers. It was relinquished by the RAAF to the Department of Civil Aviation as a Commonwealth airport after 1946, and ownership transferred to the Shire of Meekatharra in 1993.
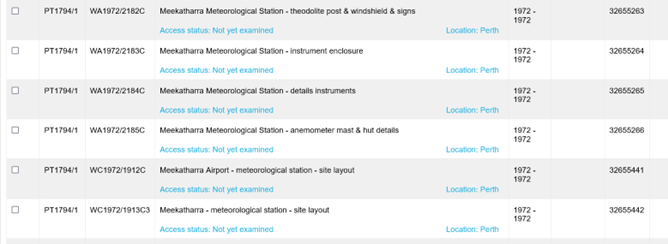
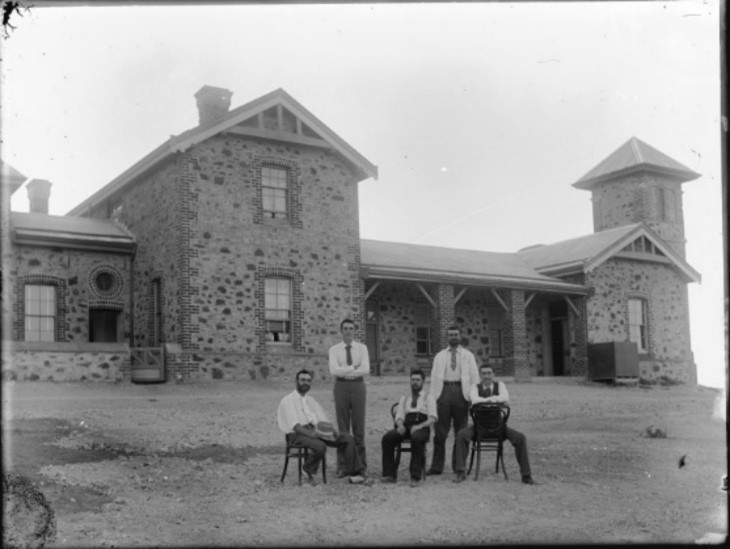
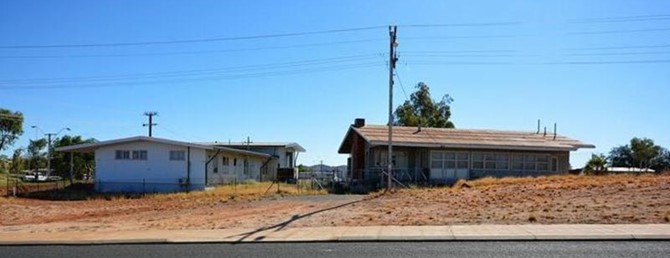
Weather observations commenced at the post office on the corner of Main and High streets Meekatharra in January 1926, having previously been reported from Peak Hill, about 110 km to the NW from 1898. Observations transferred to the former RAAF Aeradio office in 1950, and according to ACORN-SAT metadata, the site moved to a new meteorological office (MO) in about 1975 (Figure 1). However, files held by the National Archives of Australia (NAA) show that before the office was built in 1974, an instrument enclosure, instruments, a theodolite post and wind shield used in launching weather balloons were installed near the proposed new office in 1972 (Figure 2). The overlap with data from the previous Aeradio site, which continued to be used at least until staff relocated, probably in 1975 (Figure 3), was apparently used to smooth the transition to the new site.
ACORN-SAT
Meekatharra is one of 112 Australian Climate Observations Reference Network – Surface Air Temperature (ACORN-SAT) sites used by the Bureau of Meteorology, CSIRO, state governments, WWF and the Climate Council, to convince themselves, kiddies for climate action, and everyone else that the climate is warming irrevocably due to CO2.
Combined with dodgy measurement practices, data homogenisation is used at Meekatharra to create warming in maximum temperature (Tmax) data that is unrelated to the climate. Adjusting for a change in 1934 that was not significant, ignoring that the Aeradio site was watered, and that a period of overlap from 1972 was used to smooth the move to the MO site, allegedly in about 1975, for which no adjustment was made, created trends in homogenised data that were unrelated to the climate. Furthermore, data for the total of 18 sites used to homogenise Meekatharra Tmax, were not homogeneous.
The assertion that ACORN-SAT sites have been carefully and thoroughly researched, and that comparator reference sites selected on the basis of inter-site correlations would be broadly homogeneous around the time site changes occurred is demonstrably untrue. From multiple perspectives, the underlying proposition that series derived from up to 10 reference stations could provide a “high level of robustness against undetected inhomogeneities” is not supported.
As no change in the climate is detectable across the nineteen datasets examined, including Meekatharra, and the methodology is unscientific and deeply flawed, the ACORN-SAT project should be abandoned.
Figure 1. The Meekatharra meteorological office in August 2010 (from the ACORN-SAT Catalogue).
Figure 2. A screenshot of files held by the National Archives of Australia relating to the new 1972 instrument enclosure at Meekatharra (Search term Meekatharra meteorological).
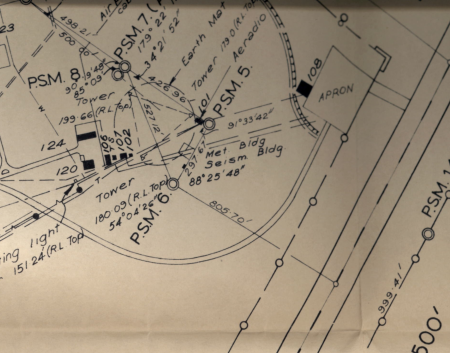
Figure 3. Building plan in 1971 showing the RFDS hanger (108), Aeradio and met-office (101), the fenced enclosure southwest of the office including met (H2) and seismograph huts, towers suspending the aerial array and earth-mat, workshop (102), fuel bowser (107), power plant (106), and workshop and equipment buildings (120 and 124).
An important link – find out more
The page you have just read is the basic cover story for the full paper. If you are stimulated to find out more, please link through to the full paper – a scientific Report in downloadable pdf format. This Report contains far more detail including photographs, diagrams, graphs and data and will make compelling reading for those truly interested in the issue.
Note: Line numbers are provided in the linked Report for the convenience of fact checkers and others wishing to provide comment. If these comments are of a highly technical nature, relating to precise Bomwatch protocols and statistical procedures, it is requested that you email Dr Bill Johnston directly at scientist@bomwatch.com.au referring to the line number relevant to your comment.
[1] Former NSW Department of Natural Resources research scientist and weather observer.
Maximum temperature data for Marble Bar exemplifies all that is wrong with the Australian Climate Observations Reference Network – Surface Air Temperature (ACORN-SAT) dataset used to depict Australia’s warming. Subjective adjustments based on faulty metadata and highly correlated comparator sites that likely embed parallel faults results in trends in homogenised data that are unrelated to the climate.
Read on …
Background
Located 150 km southeast of Port Hedland on the edge of the Great Sandy Desert, Marble Bar is reputed to be the warmest place in Australia. The dry season from April to November is extremely dry, while during the ‘wet’, potential evaporation exceeds rainfall even in the wettest month of February. Nevertheless, irregular cyclonic intrusions from the Timor Sea and eastern Indian Ocean can wreak havoc across the Pilbara including at Marble Bar.
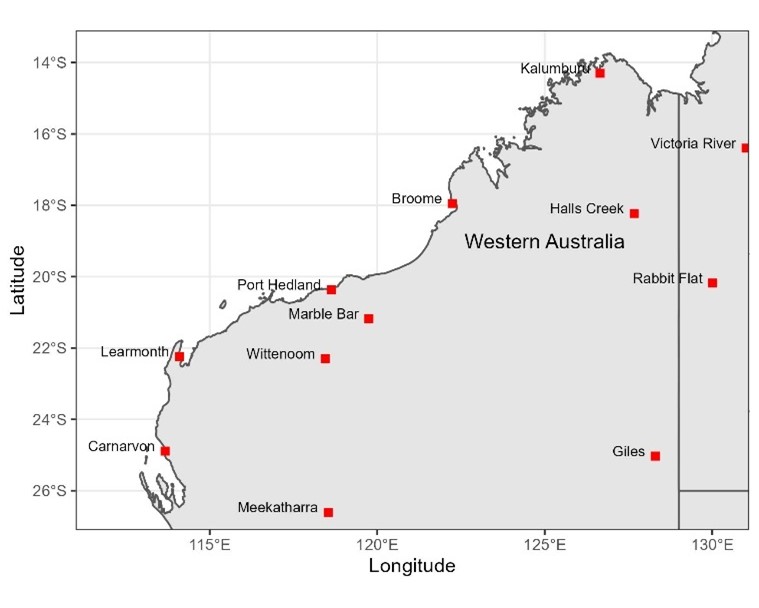
Temperature and rainfall have been measured at several locations under a variety of conditions by post office staff and volunteers since 1901. However, due to its isolation the weather station was rarely inspected by the Bureau of Meteorology (BoM), consequently metadata (data about the data) is unreliable. What was it like ‘doing the met’ under blistering hot conditions and how did equipment including thermometers fare with furnace-like winds, desert dust, and at the other extreme, cold winter nights? Typical of an arid swath of northwestern Australia, Marble Bar is an Australian Climate Observations Reference Network – Surface Air Temperature (ACORN-SAT) dataset used to calculate Australia’s warming (Figure 1).
Figure 1. Marble Bar in relation to other ACORN-SAT sites in northwestern Australia (left), and below, staff outside the original post office in 1900, which was built of local stone (State Library WA).
ACORN-SAT metadata failed to mention that a Stevenson screen was originally supplied in 1911 and that the site moved to the new post office on the corner of Francis and Contest streets in 1948 (Figure 2). Also, that the post office was extended in 1961 to accommodate the telephone line exchange which probably required the Stevenson screen to move up-hill towards the shady watered yard behind the residence. It seems the post office closed in 1984 and its functions including weather observations transferred to the general store opposite the Ironclad Hotel (now licenced post office) 230m east. Later, in 1988 the site allegedly moved east, probably to the Roadhouse, from where it relocated to its current position 100m southwest in 1997.
Figure 2. The side-view of the 1948 post office facing Francis Street (left) photographed in 2016 with the 1961 telephone line exchange annex distant from the camera, and the former residence facing Contest Street (realestate.com.au online sales brochure). Original plans show a path between the residence and the rear of the post office and several out-buildings behind including fuel store, generator/battery shed, and garage.
Objective detection of changes in data using robust statistical methods and post hoc attribution is more reliable than using ACORN-SAT and site summary metadata which is often inaccurate and incomplete. Although now restored, by 1945 the original government offices incorporating the post office had been damaged by cyclones and was riddled with termites. Planned for in 1944, the new post office shown in Figure 2 was not opened until August 1948.
A down-step in Tmax data in 1945, which ACORN-SAT interpreted as site move appeared to be due to observers consistently rounding observations down to the nearest wholeoF, which after converting to Celsius effectively reduced average rainfall-adjusted Tmax by about 0.5oC. While rounding ceased in 1960, data remained cooler than previously until 1988, when it was said the site had become overgrown and was moved “1 km to a residence”. Within that time the Stevenson screen moved clear of the 1961 telephone line exchange, which affected the frequency of high vs low extremes; observations were metricated from 1 September 1972, which affected precision; and in 1984 the site moved to the general store (the current licenced post office), where whole and ½oC were over-reported from 1995 to 1997. It was only after the site relocated in 1998 that data were reasonably consistently observed to the nearest decimal place.
Lack of precision (low R2adj) in the relationship between Tmax, rainfall and site changes, indicates the quality of Marble Bar data is relatively poor. While site changes caused Tmax data to warm 0.9oC since 1901, no warming is attributable to the climate.
Homogenisation
The Bureau’s homogenisation methods are plagued by faulty metadata and the biased selection of neighbouring sites used to make adjustments.
Read on …
The most obvious problems with the Bureau’s temperature homogenisation methods are:
Metadata for weather stations including Marble Bar is either misleading, scant or non-existent.
As no weather stations have stayed the same, it is highly likely within regions that many had undergone concurrent changes/upgrades since they were first established. Examples include post-WWII changes at aerodromes in the late 1940s, installing telephone line exchanges at post offices in the 1950s, metrication in 1972, installation of the major trunk network microwave towers in post office yards by Telecom by 1975, the staged introduction of 60-litre Stevenson screens, automatic weather stations etc.
As many weather stations are affected by synchronous changes and all exhibit similar seasonal cycles, selection of comparator datasets from the pool of possible contenders on the basis of linear correlation of first differences is bound to rank those having parallel faults as candidates for making ACORN-SAT adjustments.
Using faulty metadata to subjectively determine times when something changed, allows changepoints to be manipulated to achieve pre-determined trends. It also discourages further investigation of their cause. For instance, the 1944/1945 down-step at Marble Bar was due to a precision problem not a site move. Other changes included that from 1966 to 1985 the frequency of daily observations greater than 95th day-of-year percentiles was significantly depressed, probably due to watering or shade. Reconstructing what actually happened based on effects observed in data requires changepoints to be identified statistically using robust, statistical methods and post hoc investigation of causes.
Using Pearsons linear correlation to select up to 40 neighbouring sites for constructing comparative reference series is biased. As monthly averages cool from summer to winter and warm from winter to summer, residual cycles in first-differenced data inflate significances of correlations. Thus, from the pool of potential neighbours whose data are not homogeneous, linear correlation is likely to select those having parallel faults. Furthermore, increasing the number of comparators cannot overcome the high likelihood that station changes within regions are somewhat synchronised.
Objective, replicable homogenisation would investigate time-related changes in properties of datasets using objective statistical tests (of which there are a number) and relate changes in the data to what is known about the site post hoc. For example, by comparing detected changepoints with BoM metadata, documents, maps, plans and aerial photographs held by the National Archives and the National Library of Australia, state authorities, museums, historical societies, newspaper reports etc. Even if supporting information is not available, statistical detection based on the probability of an abrupt sustained change against the NULL hypothesis of no change should be sufficient evidence that change occurred.
Historic data were not collected to be used decades in the future to detect trend and change. Due to inaccurate metadata, poor site control (screen and instrument deterioration, watering, shade), and prior to metrication on 1 September 1972, lack of precision by observers, Marble Bar data could not be regarded as high-quality. As the Bureau’s homogenisation methods are deeply flawed the ACORN-SAT project should be abandoned.
Two important links – find out more
First Link: The page you have just read is the basic cover story for the full paper. If you are stimulated to find out more, please link through to the full paper – a scientific Report in downloadable pdf format. This Report contains far more detail including photographs, diagrams, graphs and data and will make compelling reading for those truly interested in the issue.
Second Link: This link will take you to a downloadable Excel spreadsheet containing a vast number of Marble Bar data points for the years from 1901 to 2020 and which was used in the analysis of the Marble Bar weather records to support the Full Report.
Note: Line numbers are provided in the linked Report for the convenience of fact checkers and others wishing to provide comment. If these comments are of a highly technical nature, relating to precise Bomwatch protocols and statistical procedures, it is requested that you email Dr Bill Johnston directly at scientist@bomwatch.com.au referring to the line number relevant to your comment.
[1] Former NSW Department of Natural Resources research scientist and weather observer.
Part 1. Methods case study: Parafield, South Australia
Dr Bill Johnston
scientist@bomwatch.com.au
Imagine arriving at a crime scene with a toolkit of technical knowhow, where the only evidence of what happened is some maximum temperature data and incomplete notes about where they were observed and conditions that may have affected them.
Time starts NOW …..
Background
Methods used by Bureau of Meteorology (BoM) senior research scientist Dr Blair Trewin, lead author of Working Group I of the IPCC’s 2021 Sixth Assessment report, and a member of the World Meteorological Organisation Expert Team on Climate Monitoring and Assessment, and before him Neville Nicholls, Simon Torok, Paul Della-Marta (and others) and Karl Braganza, are in urgent need of review.
All have published papers in peer-reviewed scientific journals relating to data homogenisation and based on those papers, which are in the public domain, claims have been made repeatedly by The Conversation, the ABC, The Guardian and Fairfax media and even The Australian, and for Braganza, to the 2019/20 Bushfires Royal Commission, that temperature measured at BoM weather stations has increased in recent decades due to anthropogenic emissions of CO2.
Maximum temperature (Tmax) varies up and down depending on how much net energy is convected away as latent heat via evaporation from plants, soil and surfaces (collectively referred to as evapotranspiration). As evapotranspiration at dryland sites cannot exceed the rainfall, latent heat loss equals 2.26 MJ/kg of water evaporated, equivalent to is 2.26 MJ/mm of rainfall received.
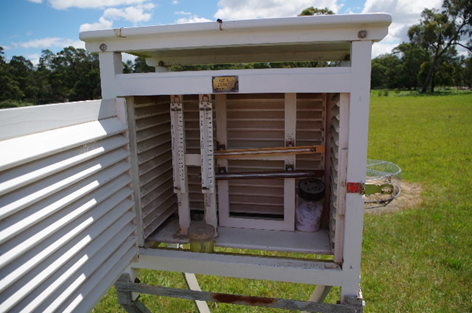
Evapotranspiration of average rainfall at Parafield (443 mm) for example, would remove 1001.2 MJ of energy (443mm times 2.26 MJ), which is 15.7% of average total solar exposure of 6345 MJ/yr. The balance, not accounted for by evapotranspiration heats the air in contact with the ground, and it is that portion of the local heat balance that is measured during the heat of the day by Tmax thermometers held 1.2m above the ground in Stevenson screens (Figure 1). It follows that for any weather station, dry years are warm and the drier it is the warmer it gets.
Figure 1. Maximum and minimum thermometers held horizontally; and dry and wet-bulb thermometers held vertically in the well-maintained 60-litre Stevenson screen at Cranbourne Botanic Gardens, Melbourne.
The First Law Theorem, that available energy is expended via latent and sensible heat pathways, provides a physical reference frame for evaluating the quality of weather station data based on the relationship between Tmax and rainfall, which should be linear and negative. The proportion variation explained by rainfall, known as the coefficient of determination (R2 or more exactly R2 adjusted for the number of terms in the model (R2adj)) provides a measure of the quality of Tmax data (Figure 2). Watering, deterioration of equipment and lackadaisical practices reduce the goodness of fit (R2adj <0.05 or 50% of variation explained), while for an excellent site it may be as high or higher than 0.7 (>70%).
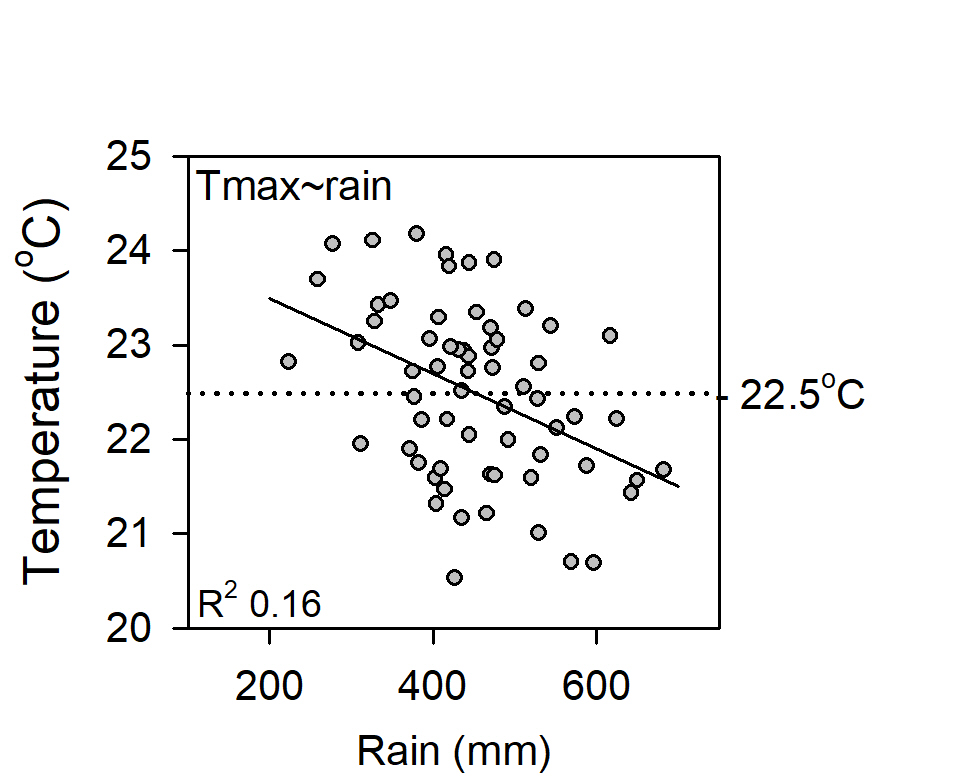
The first tool in the toolbox, naïve linear regression of the form average Tmax ~ annual rainfall, investigates the fitness of Tmax data using rainfall as the comparator or control variable. The coefficient (Tmax/100mm of rainfall), its sign (+ or ‑), significance (P level) and variation explained (R2adj) assist diagnosis of the dataset.
Read on …
Figure 2. The naïve relationship between average Tmax and annual rainfall at Parafield. Although the slope is negative and highly significant (P <0.001), only 16% (R2adj = 0.16) of variation is explained.
The line in Figure 2 only explains the rainfall portion of the Tmax signal and so while rainfall reduces Tmax ‑0.04oC/100mm and the coefficient is highly significant (the P level is less than 0.001), only 16% of variation is explained, thus, the relationship is very imprecise. So, what of the unexplained variation – the residual non-rainfall portion of the signal?
Calculated as the difference between the line (the equation), and each Tmax data-point, most statistical packages provide a table of residuals, which may be positive or negative. However, programs like Excel require them to be calculated manually (there are examples on the internet).
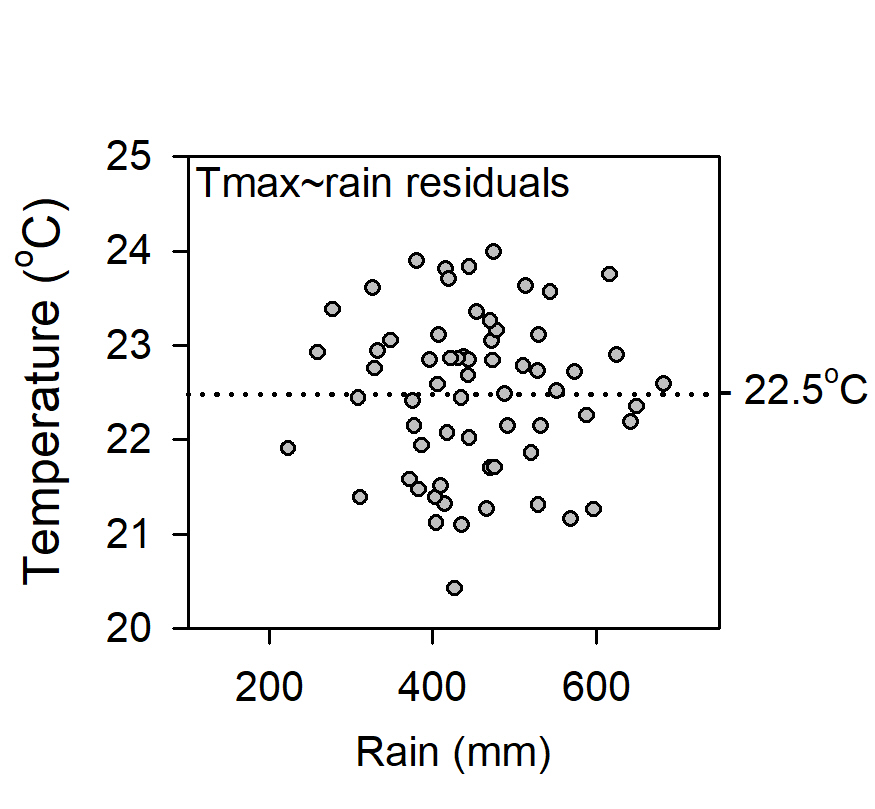
Independent statistical methods are used to examines Tmax ~ rainfall residuals – that part of the signal not related to rainfall, which if all variation is explained, should be random and free of systematic effects.
Read on …
Residuals from naïve regression are usually small, zero-centred numbers. Adding the dataset grand-mean to each value reconstitutes the original scale without changing their relativity or other properties. Except that the points in Figure 3 appear random, the Figure provides little additional information. However, while the data seem sound, low precision suggests a variable may be missing.
Figure 3. Rescaled residuals from the Tmax ~ rainfall relationship in Figure 2.
Linear regression partitions the original dataset into the portion of the Tmax signal attributable to rainfall, which is the physically deterministic covariable described by the linear fit in Figure 2, and variation that is independent of rainfall, which are the re-scaled residuals in Figure 3.
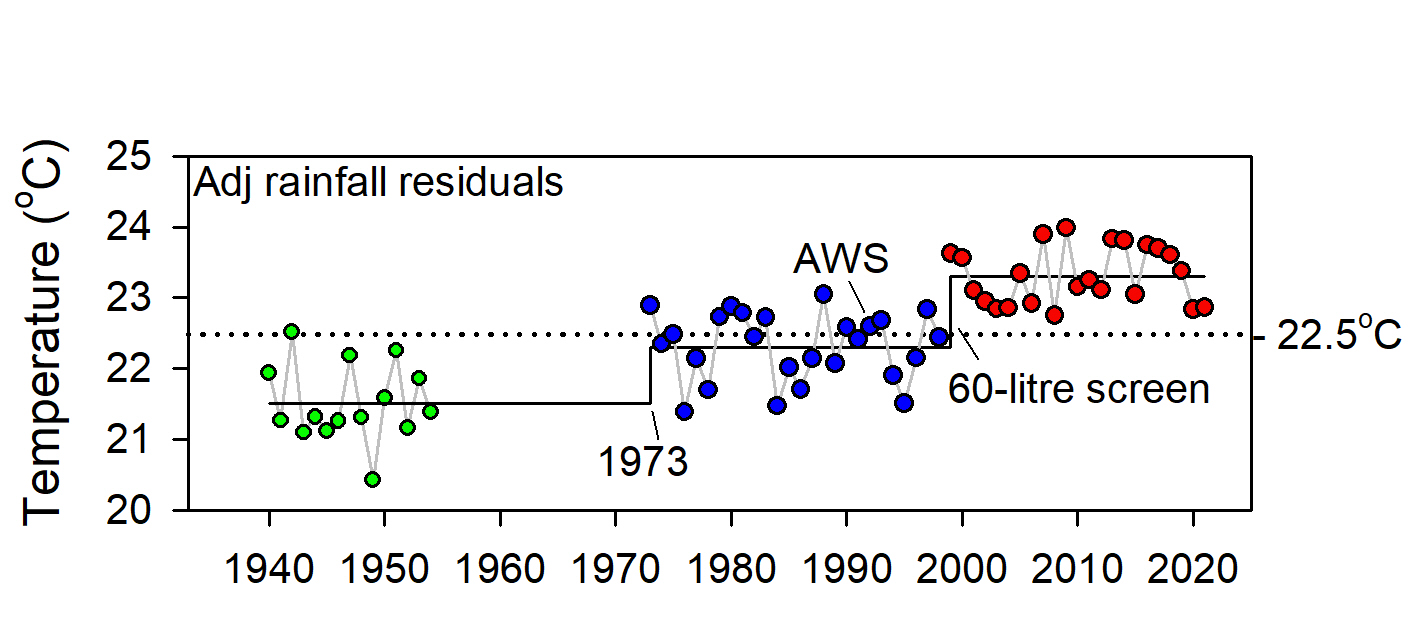
Next, the rescaled residuals in Figure 3 are analysed in the order they were observed and checked for changes that may indicate background, non-rainfall effects (Figure 4).
Figure 4. Step-change analysis of re-scaled residuals identified step-changes in 1973 which was caused by a site move before 1968, and another in 1999, probably caused by replacing a former 230-litre Stevenson screen with a more sensitive 60-litre one. (Data from 1955 to 1973 exist, but have not been digitised)
Step-changes Tmax residuals in Figure 4 were highly significant, meaning there was a very low probability they were due to chance. Analysis was undertaken using the Excel 2007 version of Sergi Rodionov’s Sequential Three-step Analysis of Regime Shifts (STARS) v6.3 (ICES Journal of Marine Science, 62: 328e332 (2005) doi:10.1016/j.icesjms.2005.01.013), which is in the public domain (https://sites.google.com/view/regime-shift-test/downloads). While other step-change tools are available (see https:// www.marinedatascience.co/blog/2019/09/28/comparison-of-change-point-detection-methods/), STARS is convenient, reliable and comparable with other methods.
Closing the case. Metadata, archived aerial photographs maps, plans, satellite images etc. are used where possible to confirm step-change scenarios and to find the combination that best fits the data. There is only one optimal outcome, which is that segmented responses to rainfall are the same (segmented regressions are parallel) and that rainfall-adjusted group means are different (segmented regressions are not coincident). While the data stepped up, no evidence was found that the climate had changed or warmed.
The BomWatch approach is objective, robust and replicable and does not involve data manipulation. It is also amenable to batch-processing of paired Tmax-rainfall datasets in the Bureau of Meteorology’s database, which would put to rest the hype about climate change and warming once-and-for-all.
Read on …
Bias in the BoM’s homogenisation methods
Comparative homogenisation methods used by the Bureau are highly questionable. Problems include:
Use of faulty and unreliable metadata for specifying/verifying changepoints in target site data (data to be homogenised);
First-differenced linear correlation with the target-site data, selects comparators that likely embed parallel faults;
Overly complicated methods lack transparent checks and balances that provide confidence that their methods are trustworthy.
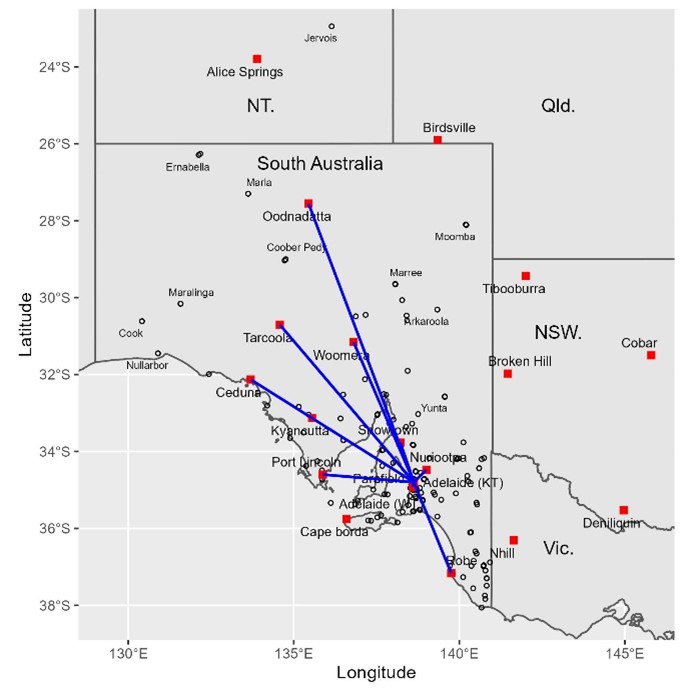
Data for Parafield airport (Bureau ID 23013) commence on 1 April 1939 but site-summary metadata does not provide coordinates for the site. Google Earth Pro shows the current Almos automatic weather station (AWS) is near the centre of the airport about 1 km south of the control tower at Latitude ‑4.7977, Longitude 138.6281. While data show a naïve trend of 0.31oC/decade (3.1oC/century) a gap in available data from 1955 to 1973 is unexplained. Due to step-changes before 1973 and in 1999, data are not homogeneous, nevertheless, together with other sites, Parafield was used to homogenise ACORN-SAT sites at Oodnadatta, Tarcoola, Woomera, Ceduna, Kyancutta, Port Lincoln, Nuriootpa, Adelaide (Kent Town) and Robe in 2011 (Figure 5).
Figure 5. The first (2011) iteration of ACORN-SAT used data for Parafield Airport, 15 km west of Adelaide, with other cross-correlated sites to homogenise ACORN-SAT sites at Oodnadatta (859 km distant), Tarcoola, Woomera, Ceduna (546 km), Kyancutta, Port Lincoln, Nuriootpa, Adelaide (Kent Town) and Robe. ACORN-SAT sites are indicated by red squares. Weather stations in South Australia having >20 years of data are indicated by open circles, some of which are named.
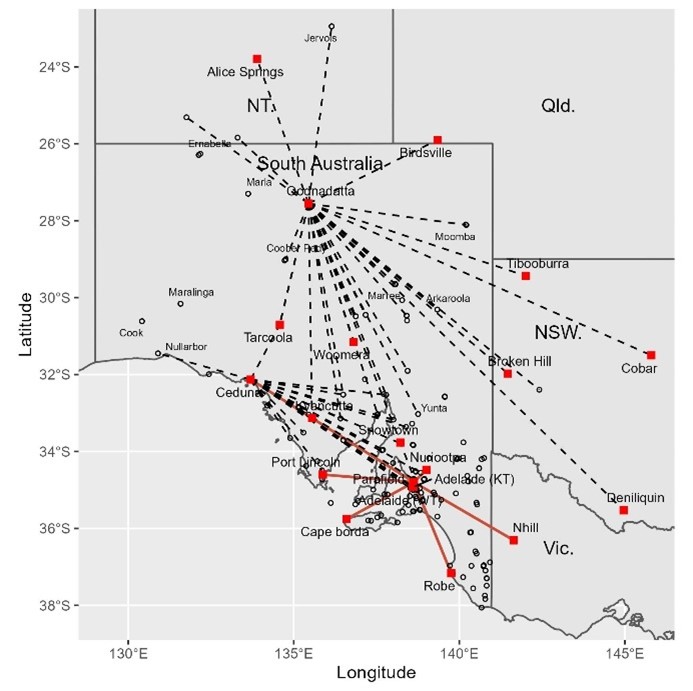
In contrast to Acorn-Sat v.1, the 2021 iteration (v2.2) used Parafield with other cross-correlated sites to only adjust Adelaide (Kent Town), Cape Borda, Port Lincoln, Robe, Kyancutta, Nhill and Ceduna (Figure 6). So, something in the method caused Parafield to be used for some sites in 2011, but not the same sites in 2021. Illustrating the complexity of the Bureau’s methods, radar graphs show location of the 24 sites used to homogenise Ceduna in 2021 and the 30 sites used for Oodnadatta. (The great circle distance from Oodnadatta to Deniliquin airports is 1263 km and to Cobar 1096 km.)
Figure 6. ACORN-SAT v.2 used Parafield airport data with other cross-correlated sites, to only homogenise ACORN-SAT sites at Adelaide (Kent Town), Cape Borda, Port Lincoln, Robe, Kyancutta, Nhill and Ceduna, which is a geographically less-dispersed suite compared to v.1. The radar plots locate the of 24 sites in total, used to homogenise ACORN-SAT data for Ceduna and the 30 sites used for Oodnadatta.
Homogenisation of Australia’s temperature record underpins the Australian government’s decarbonisation agenda including upheavals in energy supply networks, rapid increases in energy costs that will force energy-intensive industries offshore, and the destruction of habitats and despoiling of landscapes by wind turbines, solar panels and woody-weeds.
While true costs have not been revealed, the impact on future generations will be at a scale never envisaged by those advocating for change. While elites will accumulate wealth and power, those agitating on their behalf for climate justice and other paradoxical causes are laying the foundations for their own highly indebted, personally limiting Orwellian future. Without abundant, reliable, affordable energy and exports of minerals, coal and agricultural commodities to support orderly market-based transitions, including to nuclear power, Australia risks becoming a voiceless, crippled, heavily manipulated society devoid of a productive base.
Conclusions
The Bureau’s homogenisation methods lack rigor, replicability and quality control and are likely to result in trends that have nothing to do with the climate. Selection of comparator neighbouring datasets on the basis of first-differenced correlations axiomatically identifies those with parallel faults.
Use of reference series composed of data that are not homogeneous to detect and adjust changes in ACORN-SAT data has no scientific or statistical merit and should be abandoned.
An important link – find out more
The page you have just read is the basic cover story for the full paper. If you are stimulated to find out more, please link through to the full paper – a scientific Report in downloadable pdf format. This Report contains far more detail including photographs, diagrams, graphs and data and will make compelling reading for those truly interested in the issue.
Note: Line numbers are provided in the linked Report for the convenience of fact checkers and others wishing to provide comment. If these comments are of a highly technical nature, relating to precise Bomwatch protocols and statistical procedures, it is requested that you email Dr Bill Johnston directly at scientist@bomwatch.com.au referring to the line number relevant to your comment.
Dr Bill Johnston
25 November 2022
Note: Line numbers are provided in the linked Report for the convenience of fact checkers and others wishing to provide comment. If these comments are of a highly technical nature, relating to precise Bomwatch protocols and statistical procedures, it is requested that you email Dr Bill Johnston directly at scientist@bomwatch.com.au referring to the line number relevant to your comment.
The work of citizen scientist, Dr. Lindsay Moore, has failed to confirm an important IPCC prediction about what will happen to the spread between maximum and minimum temperatures due to the Enhanced Greenhouse Effect. The IPCC’s position is that this spread will narrow as a result of global warming.
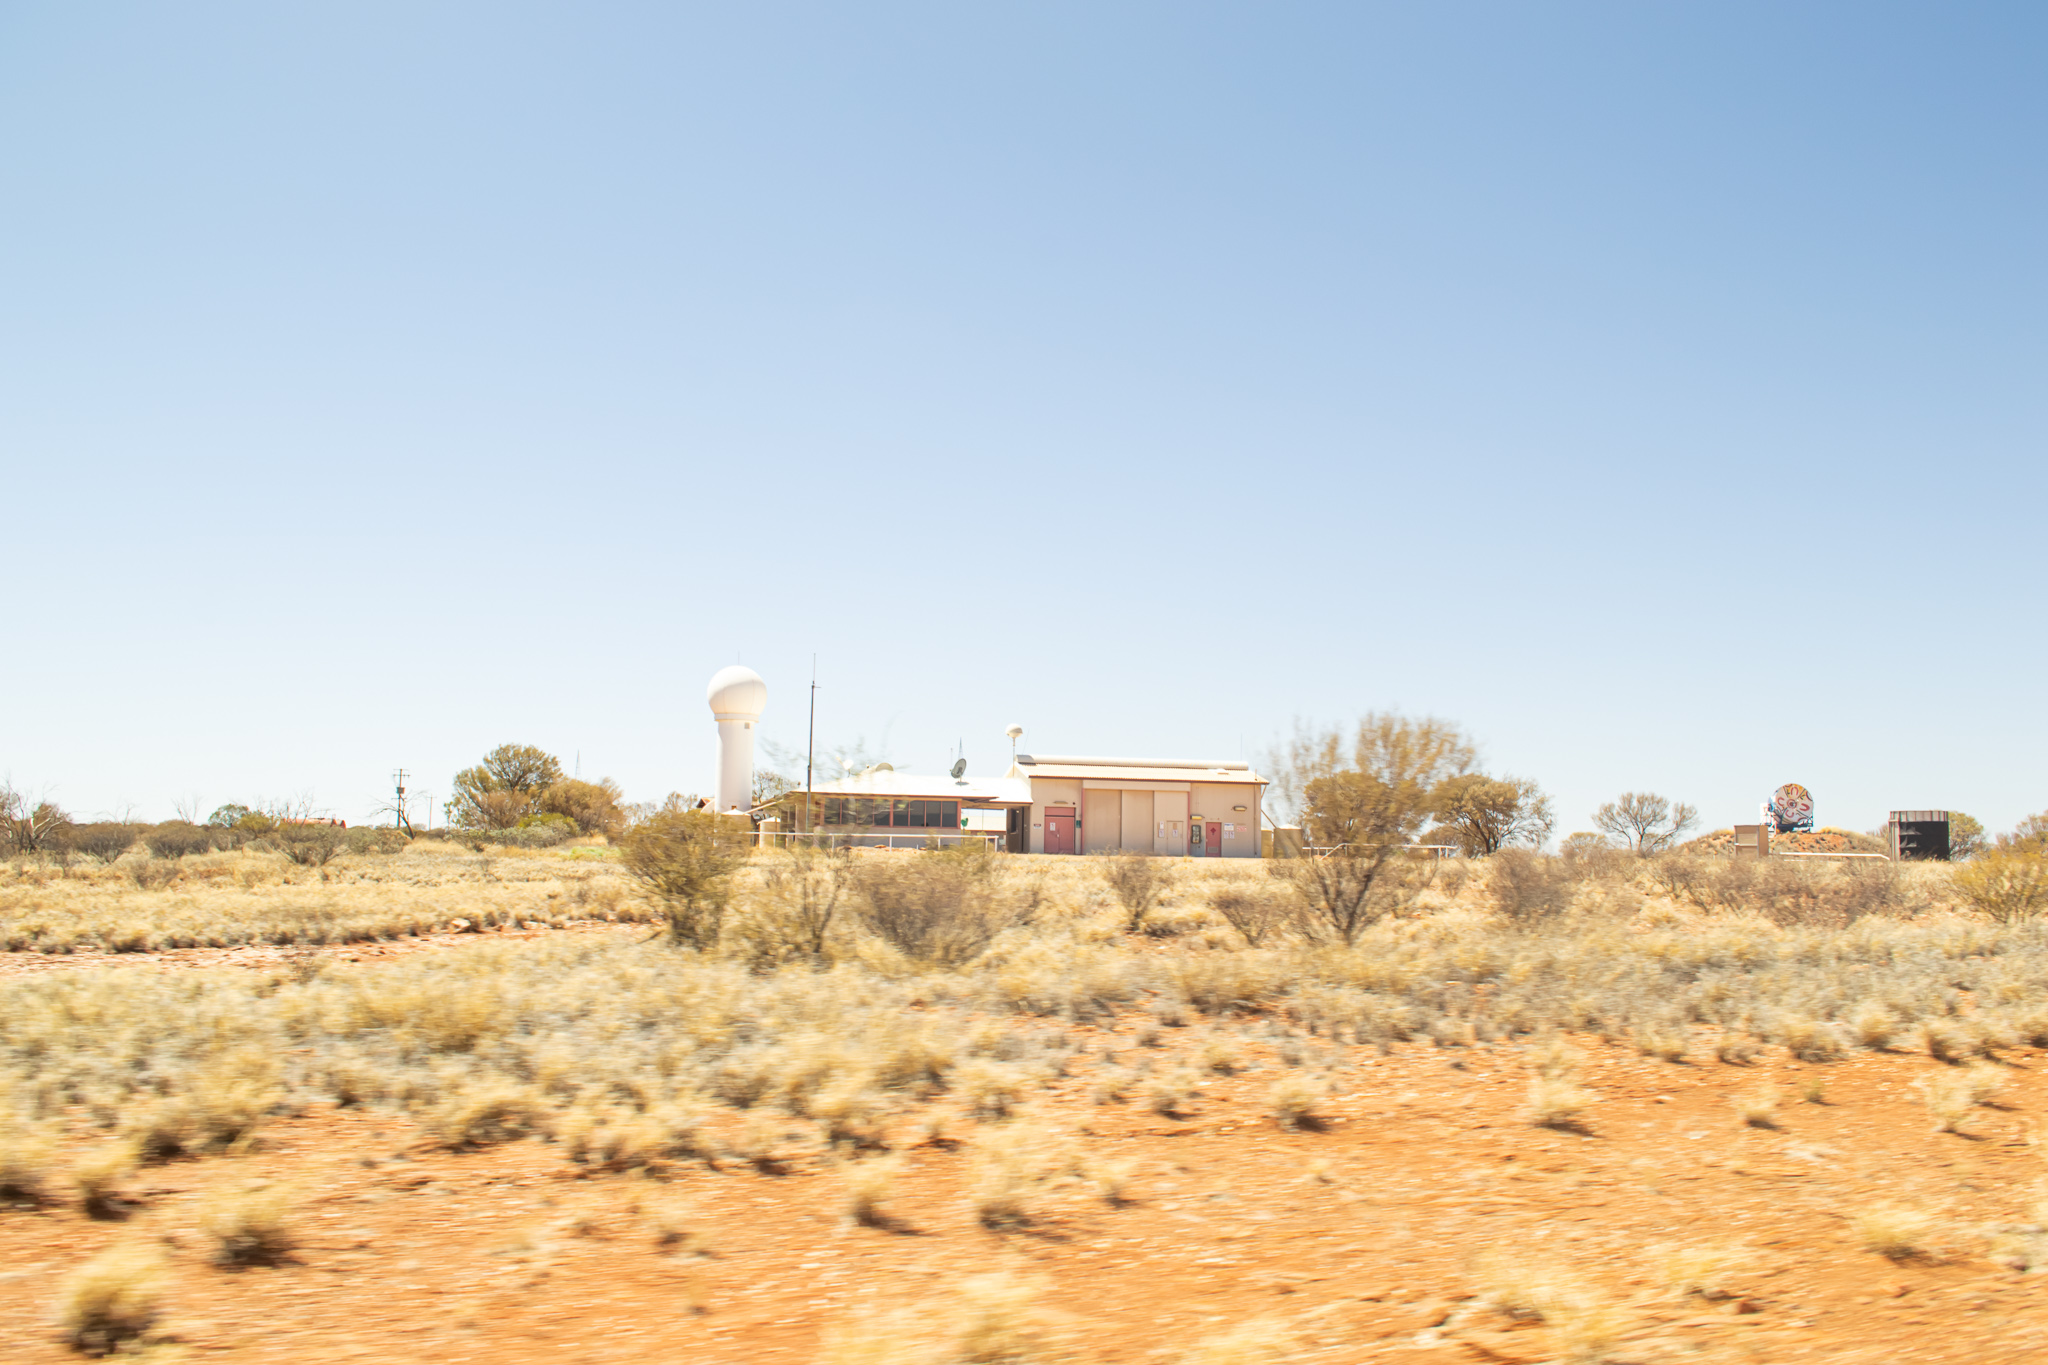
Moore’s work focuses on the remote weather station at Giles in Western Australia and run by Australia’s peak weather monitoring body, the Bureau of Meteorology (BoM).
Why Giles?
Giles is the most remote weather station in mainland Australia and its isolation in a desert makes it an ideal place to study the issue of temperature spread. It is virtually in the middle of the Continent.It is far from influencing factors such as Urban Heat Island effect, land use changes, encroachment by shading vegetation, shading by buildings and so on, that can potentially corrupt the data. Humidity is usually low and stable and it is far from the sea. In addition, as a sign of its importance in the BoM network, Giles is permanently staffed.
As stated, the IPCC hypothesis is that the ‘gap’ will become steadily smaller as the Enhanced Greenhouse Effect takes hold. As temperature rises the gap will narrow and this will result in an increase in average temperature, so says the IPCC.
Moore’s research indicates that this is just not happening at this showcase BoM site. It may be happening elsewhere, and this needs to be tested in each case against the range of all data-corrupting effects, but it is not happening at Giles.
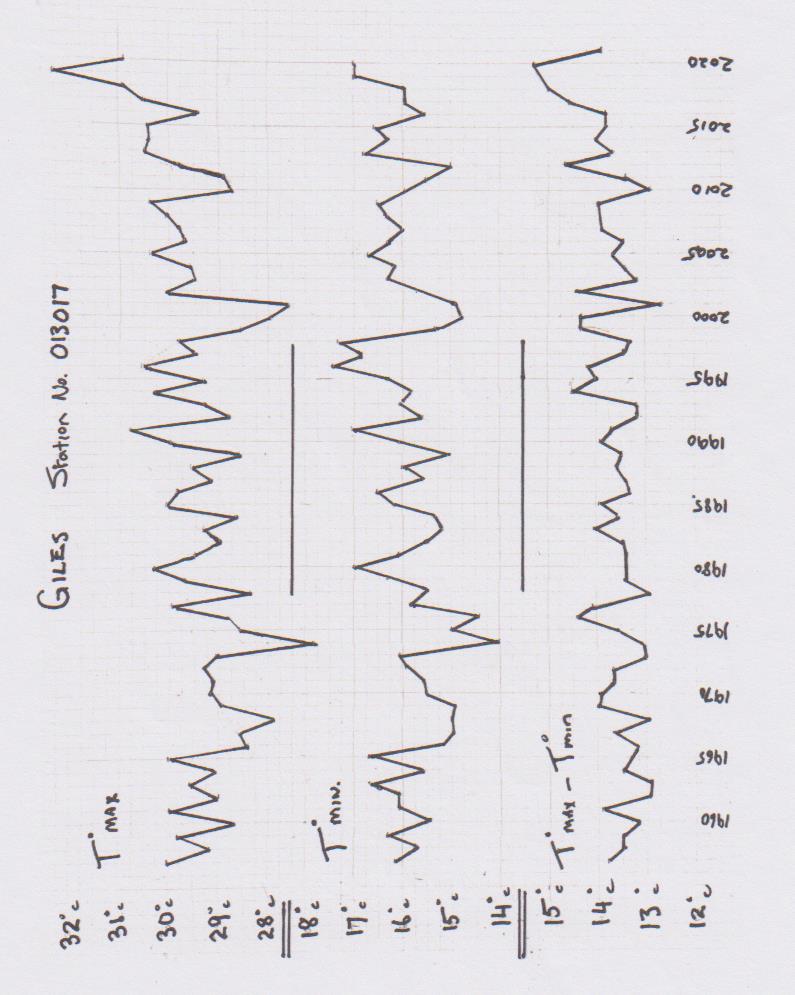
Notes about the graphs.The top plot line shows the average Tmax for each year – that is, the average maximum daytime temperature.The middle plot shows the average Tmin for each year – that is, the average minimum night time temperature.
The lower plot shows the result of the calculation Tmax-Tmin. In laypersons’ terms it is the result you get when you subtract the average yearly minimum temperature from the average yearly maximum temperature.If the IPCC hypothesis is valid, then the lower plot line should be falling steadily through the years because, according to the IPCC, more carbon dioxide in the atmosphere should make nights warmer. Hence, according to the IPCC’s hypothesis, the gap between Tmax and Tmin will become smaller – ie the gap will narrow. But the plot line does not show this.
The IPCC’s reasoning for its narrowing prediction is that global warming will be driven more by a general rise in minimum temps that it will be by a general rise in maximums. This is not my assertion, nor is it Dr. Moore’s, it is the assertion of the IPCC and can be found in the IPCC’s AR4 Report.
Dr. Moore states, “In the AR4 report the IPCC claims that elevated CO2 levels trap heat, specifically the long wave radiation escaping to space.
“As a result of this the IPCC states at page 750 that, ‘almost everywhere night time temperatures increase more than day time temperatures, that decrease in number of frost days are projected over time, and that temperatures over land will be approximately twice average Global temp rise,” he says citing page 749 of the AR4 report.
So where can we go to find evidence that the IPCC assertion of a narrowing spread of Tmax-Tmin is either happening or not happening? Giles is a great start point. Can we use the BoM’s own publicly available data to either confirm, or disprove, the narrowing prediction? The short answer is – Yes we can.
But, before we all get too excited about the result Dr. Moore has found, we need to recognise the limitation that this is just one site and, to the cautious scientific mind, may still be subject to some bizarre influence that somehow skews the result away from the IPCC prediction. If anyone can suggest what viable contenders for ‘bizarre influences’ might be at Giles we would welcome them in the comments section of this post.
The caution validly exercised by the rigorous scientific mind can be validly balanced by the fact that Giles is a premier, permanently staffed and credible site. The station was also set up with great care, and for very specific scientific purposes, in the days of the Cold War as part of the British nuclear test program in Australia in the 1950’s. It was also important in supplying timely and accurate meteorological data for rocket launches from the Woomera Rocket Range in South Australia in the development of the Bluestreak Rocket as part of the British/Australian space program. This range extended almost all the way across Australia from the launching site at Woomera to the arid North West of Western Australia.
In the early years there were several other weather monitoring stations along the track of the range. Such has been the care and precision of the operation of the station that Giles has the characteristics of a controlled experiment.
Dr. Moore states, “Giles is arguably the best site in the World because of its position and the accuracy and reliability of its records which is a constant recognised problem in many sites. Data is freely available on the BoM website for this site.”
With regard to the site validly having the nature of a controlled experiment, something about the method of analysis is also notable. The novel adoption of deriving the spread Tmax-Tmin by doing it on a daily basis neatly avoids meta data issues that have plagued the reliability of data from other stations and sometimes skewed results from other supposedly reliable observation sites.
“I would argue that the only change in environmental conditions over the life of this station is the increase in CO2 from 280 to 410 ppm,” he says.
“In effect this is, I suggest, a controlled experiment with the only identifiable variable input being CO2 concentration,” he says.
The conclusion reached by Dr. Moore is that an examination of the historical records for this site by accessing the same data through the BoM website unequivocally shows NO significant reduction in Tmax-Tmin. It also shows no rise in Tmin. Anyone can research this data on the Bureau of Meteorology website as it is not paywalled. It is truly sound data from a government authority for the unrestricted attention of citizens and other researchers.
Dr. Moore concludes, “The logical interpretation of this observation is that, notwithstanding any other unidentified temperature influencing factor, the Enhanced Greenhouse Effect due to elevated CO2 had no discernible effect on temperature spread at this site. And, by inference, any other site.”
He further states, “On the basis of the observations I have made, there can be no climate emergency due to rising CO2 levels, whatever the cause of the rise. To claim so is just scaremongering.
“Any serious climate scientist must surely be aware of such basic facts yet, despite following the science for many years, I have never seen any discussion on this specific approach,” he says.
Finally, Dr. Moore poses a few questions and makes some pertinent points:
He asks, “Can anyone explain, given the current state of the science why there is no rise in minimum temperatures (raw) or, more importantly, no reduction in Tmax-Tmin spread, over the last 65 years of records despite a significant rise in CO2 levels at Giles (280-410ppm) as projected by the IPCC in their AR4 report?” He notes that other published research indicates similar temperature profiles in the whole of the central Australian region as well as similarly qualified North American and World sites.
Seeking further input, he asks, “Can anyone provide specific data that demonstrates that elevated CO2 levels actually do increase Tmin as predicted by the IPCC?” And further, “Has there been a reduction in frost days in pristine sites as predicted by the IPCC?”
On a search for more information, he queries, “Can anyone explain why the CSIRO ‘State of the Climate’ statement (2020) says that Australian average temperatures have risen by more than 1 deg C since 1950 when, clearly, there has been no such rise at this pristine site?” With regard to this question, he notes that Giles should surely be the ‘go to’ reference site in the Australian Continent.
Again he tries to untangle the web of conflicting assertions by reputedly credible scientific organisations. He notes that, according to the IPCC rising average temperatures are attributable to rise in minimum temperatures. For the CSIRO State of the Climate statement to be consistent with this, it would necessitate a rise of around 2 deg C in Tmin. But, at Giles, there was zero rise. He also notes that, according to the IPCC, temperature rises over land should be double World average temperature rises. But he can see no data to support this.
Dr. Moore’s final conclusion: “Through examination of over 65 years of data at Giles it can be demonstrated that, in the absence of any other identifiable temperature forcing, the influence of the Enhanced Greenhouse Effect at this site appears to be zero,” he says. “Not even a little bit!”
David Mason-Jones is a freelance journalist of many years’ experience. He publishes the website www.bomwatch.com.au
Dr. Lindsay Moore, BVSC. For approaching 50 years Lindsay Moore has operated a successful veterinary business in a rural setting in the Australian State of Victoria. His veterinary expertise is in the field of large animals and he is involved with sophisticated techniques such as embryo transfer. Over the years he has seen several major instances in veterinary science where something that was once accepted on apparently reasonable grounds, and adopted in the industry, has later been proven to be incorrect. He is aware that this phenomenon is not only confined to the field of Veterinary Science but is happens in other scientific fields as well. The lesson he has taken from this is that science needs to advance with caution and that knee-jerk assumptions about ‘the science is settled’ can lead to significant mistakes. Having become aware of this problem in science he has become concerned about how science is conducted and how it is used. He has been interested in the global warming issue for around 20 years.
General link to Bureau of Meteorology website is www.bom.gov.au
There is no evidence that melting glaciers, increasing levels of atmospheric CO2 or expansion of the oceans due to rising temperatures has caused sea levels to increase at Cooktown. Consequently, the likelihood that sea level will rise by 26 to 29 cm by 2030 as suggested by the IPCC is far-fetched.
As trends measured by multiple tide gauges adjacent to the reef differ from satellite-based estimates, and time-lapse aerial photographs since the 1950s show no shoreward encroachment of tidal wetting fronts, satellite data should not be used in critical studies or to inform government policy.
The El Niño Southern Oscillation exerts an overarching impact on fluctuations in sea level and other climate and environmental variables.
Background
The Great Barrier Reef Marine Park Authority (GBRMPA) claims that due to global warming, sea level is increasing and that the fastest rate of sea level rise is in the northern sector of the Reef. Further, the Intergovernmental Panel on Climate Change (IPCC) predicts sea level will rise by around 26 to 29 centimetres over the next 9-years (i.e., by 2030) and by 47 to 62 centimetres by 2080.
But is it true or is it just untrustworthy science?
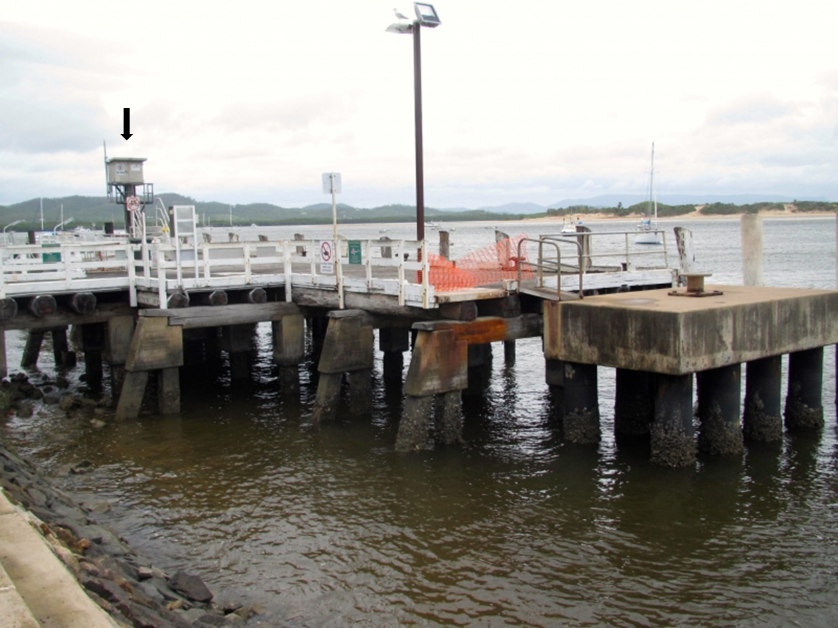
Rapid rates of sea level change should be evident in mean sea level (MSL) measured by tide gauges relative to the land, especially at Cooktown where Maritime Safety Queensland has operated an automatic tide gauge since January 1996 (Figure 1). Also, evidence of shoreline encroachment resulting from sea level rise should be obvious in time-series of aerial photographs available from Queensland Government archives since the 1950s and 1960s.
Figure 1. The Cooktown storm surge tide gauge (arrowed) located on the wooden-decked wharf prior to its restoration in 2015. (Photo 44740 from the Cultural Atlas of Australia.)
What we did
High-frequency (10-minute) tide gauge data was downloaded from the Queensland Government Open Data portal, aggregated into monthly averages and analysed using a technique that partitioned variation IN the data caused by influential covariables, from underlying impact variables that impacted ON the data-stream.
Aerial photographs taken in 1969, 1974, 1979, 1983, 1987, 1989, 1991, 1994 and high-definition Google Earth Pro Satellite imagery were also examined for signs of tidal encroachment at Cherry Tree Bay east of Cooktown across the peninsula.
What we found
The Bureau of Meteorology Southern Oscillation Index (SOI) was the most influential of a range of climate and environmental variables that affected MSL. Rainfall and rainfall two months previously (RainLag2) also explained a statistically significant but small portion of MSL variation. Having accounted for those covariables, extraneous factors impacting on the data-stream caused step-changes in 1997, 2009 and 2015.
Following Tropical Cyclone Justin in March 1997, a major dredging campaign removed 108,000 m3 of accumulated sediment from the harbour floor, which caused the wharf supporting the tide gauge to settle about 40 mm into the bed of the river by January 1998. Dredging of more sediment in 1999 (26,000 m3) did not affect the gauge. However, in March 2009 it settled a further 37 mm probably as a result of disturbances caused by TC Ellie (30 January to 4 February 2009) and TC Hamish (4 to 11 March 2009). The harbour was dredged again following TC Ita in 2014 (60,000 m3), then in January 2015 the former wooden wharf that supported the tide gauge was strengthened and re-decked with a new composite material capable of allowing small trucks to load and unload supplies (https://www.wagner.com.au/main/our-projects/cooktown-wharf/). Dredging and refurbishment caused the tide-gauge to settle a further 32 mm. Step-changes underlying the data-stream show the gauge is not well-secured to the harbour floor.
The highly significant step-changes (P <0.001) totalling 109 mm (SEM 9.4 mm) accounted for all the apparent MSL trend. There is no evidence therefore that sea level is rising in the northern sector of the Reef. The IPCC prediction that sea levels will increase globally by 26 to 29 cm by 2030 is an unlikely scenario.
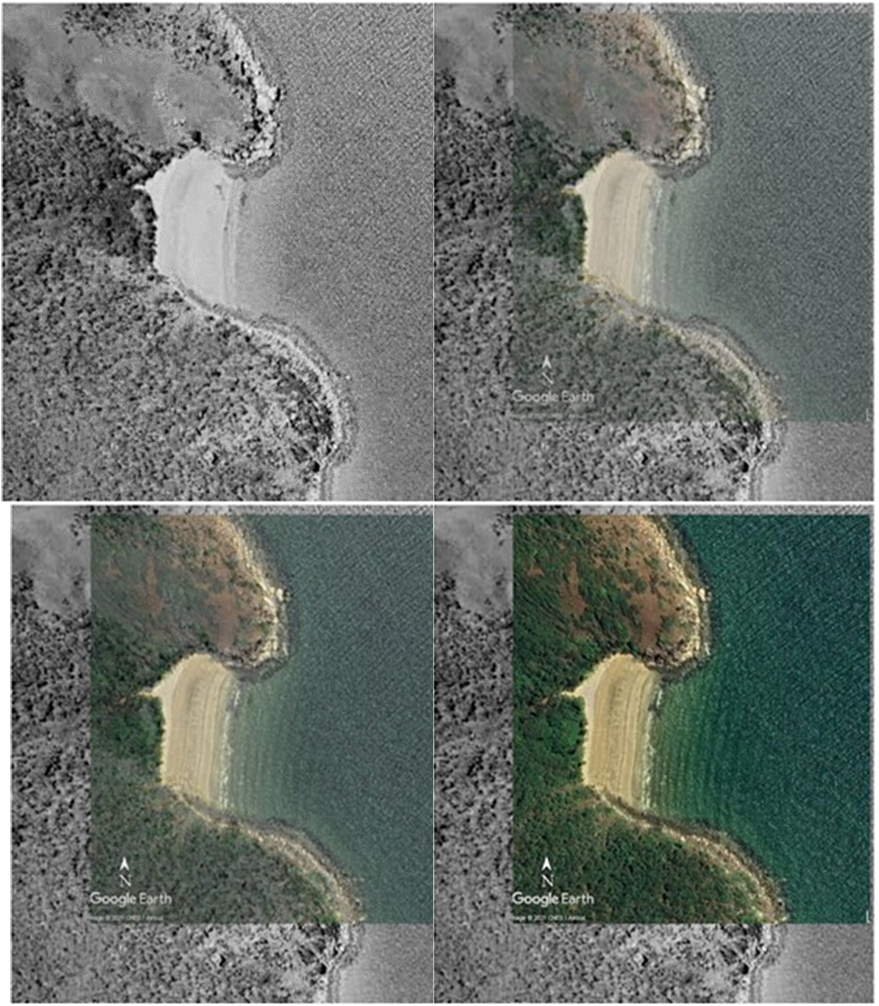
A Queensland Government aerial photograph taken on 11 September 1969 was re-scaled and oriented so features across the peninsula east of Cooktown including the well-defined Cherry Tree Bay and associated rocky headlands can be directly compared as an overlay on a Google Earth Pro satellite image taken on 16 September 2018.
Marked where they intersect the headlands, tidal wetting fronts are the same along the low-gradient beach. Littoral zones around the headlands that define inter-tidal habitats also directly align. The same shoals and individual shore-line rocks, the small watercourse draining to the beach: all the same. There is no evidence of tidal encroachment and therefore no evidence that sea levels have materially changed over the intervening 49-years (Figure 2).
What we conclude
Satellite data depended upon by IPCC do not stack-up with tide gauge data or aerial photographs taken between 1969 and 1994 compared with high-definition Google Earth Pro Satellite imagery of the same sandy-beach.
It seems that while CSIRO et al. can model sea level relative to some point at the centre of the earth with mm/year precision using satellites traversing the same patch of heaving ocean every 20-days or so, they and other oceanographers and elite climate scientists lack the skills to analyse tide gauge records or interpret aerial photographs they can freely download from the internet.
Satellite data upon which speculation relating to sea level rise depends, is pre-loaded with trend and should not be used for critical studies, for spreading alarm or for informing government policy. It is a ridiculous notion that sea levels will increase by almost 300 mm during the next 9-years.
Figure 2. Aerial photograph of Cherry Tree Bay, east of Cooktown taken on 11 September 1969 overlaid on Google Earth Pro (GEP) Satellite image for 16 September 2018; upper-left, GEP opacity 0%, 50%; lower-left 75%, 100%. Tidal wetting fronts, littoral zones, rocks and shoals show no encroachment or change in exposure due to rising sea levels over the intervening 49-years.
Two important links – find out more
First Link: The page you have just read is the basic cover story for the full paper. If you are stimulated to find out more, please link through to the full paper – a scientific Report in downloadable pdf format. This Report contains far more detail including photographs, diagrams, graphs and data and will make compelling reading for those truly interested in the issue.
Second Link: This link will take you to a downloadable Excel spreadsheet containing a vast number of Data points for the Cooktown tide gauge and which was used in the analysis of the sea level situation at Cooktown to support the Full Report.
If melting of glaciers and icesheets in Greenland in recent decades significantly influenced mean sea level (MSL) it would be detectable in data for Cape Ferguson from 1991 and Townsville Harbour from 1959. However, there was no evidence that climate change, warming or melting ice sheets has caused sea levels to increase.
Tide gauges are affected by the conditions under which they operate. Data are coarse, imprecise, poorly documented and not understood by climate scientists and oceanographers who routinely conflate variation caused by covariates such as the El Niño Southern Oscillation, components of local water balances, and step-changes caused by site and instrument changes as being due to the climate.
In order to draw valid conclusions, it is imperative that scientists implement a quality assurance process that distinguishes between variables that cause variation IN data (covariables), from those that impact ON the data-stream (impact variables) and adjust for those using independent statistical methods.
Scores of peer reviewed papers published at great expense in elite scientific journals, by multiple authors supported by long reference lists are biased by lack of attention to detail and poor science. Using Cape Ferguson as a case study, and replicated using data for Townsville Harbour, the approach outlined here, which is widely applicable, sets a benchmark for undertaking due diligence on data. Findings of papers that failed to assess the fitness of data used to determine trend and change should be disregarded.
Background
Australia’s lead management agency for the Great Barrier Reef, the Great Barrier Reef Marine Park Authority (GBRMPA) states on their website that “global average sea level rose by 0.18 centimetres per year from 1961 to 2003. The total rise from 1901 to 2010 was 19 centimetres, which is larger than the average rate during the previous 2000 years.” (https://www.gbrmpa.gov.au/our-work/threats-to-the-reef/climate-change/sea-level-rise).
Further, they say that “Since 1959, records of sea levels for Townsville, in north Queensland, show an average increase of 1.2mm per year. However, the rate of increase may be accelerating, with records of sea levels at Cape Ferguson near Townsville showing an average increase of 2.9mm every year between 1991 and 2006.” How can it be that for the same waterbody, sea level is increasing 2.5 times faster just 25 km away from Townsville Harbour at Cape Ferguson?
GBRMPA goes on to claim that “because much of the land adjacent to the Great Barrier Reef is low-lying, small changes in sea level will mean greater erosion and land inundation. This will cause significant changes in tidal habitats, such as mangroves, and move saltwater into low-lying freshwater habitats. This will have flow-on effects for juvenile fish that use these habitats for protection and food resources.” So how can that be that compared with current satellite imagery aerial photographs from the 1950s and 1960s show wetting fronts on beaches and tidal influences on rocky headlands such as Cape Cleveland are unchanged?
Paid for by taxpayers, led by government agencies including CSIRO and the Bureau of Meteorology, ably assisted by the Australian Institute of Marine Science (AIMS) and barracked-on by slick campaigns run by WWF, the Climate Council, the Australian Museum, the Great Barrier Reef Foundation et al., Australians are bombarded by confusing, over-hyped mis-information and scare-campaigns related to the Great Barrier Reef.
Disaster-porn has replaced knowledge and understanding to the point that Australia’s climate history has been substantially re-written. Like a billion-dollar cart of hay put before the science-horse, in almost every sphere, policy-driven science has overtaken the scientific method.
Coupled with previous exposés that showed apparent trends in maximum temperatures at Cairns, Townsville and Rockhampton were caused by homogenisation adjustments and not the climate [LINK], this series of investigations examines monthly sea-level data measured at Cape Ferguson since September 1991 and the longer record for Townsville Harbour since January 1959. The aim is to independently verify that due to anthropogenic warming, survival of the Great Barrier Reef is imperilled by compounded multiple threats including sea-level rise. Of overriding concern is that on behalf of their ‘independent’ boards and sponsors, scientists may have been led astray by liberally-scattered golden-hay, and thereby lost pride in their scientific work.
What we did
Using the 30-year monthly MSL dataset for Cape Ferguson as a case study, we objectively distinguished between variables that cause variation IN tide-gauge data (covariables) from those that impacted ON the data-stream (impact variables). The approach outlined in the paper provides climate scientists and oceanographers with a method for verifying that data they use is fit for purpose i.e., that trend reflects the oceanographic waterbody and not covariables and/or effects caused by site and instrument changes. The Cape Ferguson study was replicated using the 62-year monthly dataset for Townsville Harbour.
Principle findings
At Cape Ferguson, 31.9% of variation in MSL was accounted for by (in order of importance), SOI3pt; barometric pressure (hPa); lag1 solar exposure (MJ/m2); Lag2 rainfall (mm), and current rainfall. Accounting for a step-change in 2009 caused by a change in calculating 10-minute values from 1‑second samples, and a residual 18.06-year cycle, increased R2adj to 0.645 (64.5%). Having removed variation INthe data and the effect of the inhomogeneity ON the data-stream, no trend or change was attributable to any latent factor such as melting glaciers and icecaps in Greenland, coal mining or global warming.
The dataset for Townsville Harbour from January 1959, was nosier than Cape Ferguson, partly because data before 1984 were manually digitised from tide gauge charts and also because water levels in the harbour, which lies at the entrance to Ross Creek are greatly influenced by hydrological processes within the catchment, including urban development, irrigation, leakage etc. Thus, while SOI3pt was less influential, components of the water-balance (rainfall, evaporation and seasonality) were more so. Significant covariables accounted for 25.3% of variation in MSL.
Step-changes in residuals aligned with construction of the Ross River Dam in 1971 and its enlargement 2007. A third inhomogeneity in 1987 may have been associated with harbour developments or an undocumented change related to the gauge. Significant variables and step-changes together accounted for 49.2% of MSL variation.
Although MSL data were affected by random noise no residual trends or changes were due to any other systematic factor including warming of the climate or the ocean.
An important link – find out more
The page you have just read is the basic cover story for the full paper. If you are stimulated to find out more, please link through to the full paper – a scientific Report in downloadable pdf format. This Report contains far more detail including photographs, diagrams, graphs and data and will make compelling reading for those truly interested in the issue.
#1. Heat exchanges with the landscape bias trends in sea surface temperature (SST) measured close to shore such as at Cape Ferguson near Townsville (Latitude -19.2774o, Longitude 147.0586o), especially during periods of low summer rainfall when maximum temperature (Tmax) is axiomatically higher. Removing seasonal cycles, which show no trend, and accounting for the significant effect of terrestrial Tmax and barometric pressure (hPa), left no trend of change attributable to any other factor. While Tmax is clustered into dry-warm and moist-cool years, there is no evidence that SST has warmed since records commenced in September 1991.
#2. At Cape Ferguson SST cools more slowly from its peak in January to July than it warms from August to to December. Great Barrier Reef (GBR) ecosystems must therefore be adapted to the 8.1C interannual cycle and average month-to-month SST changes of up to 2C.
#3. Australian Institute of Marine Science (AIMS) SST data is short, patchy, poorly dispersed towards the extremities of the Reef and not useful for estimating trend. Selecting day-of-year averages for 27 sites extending from Thursday Island Cape York to North Solitary Island in the south showed Reef ecosystems are adapted to average temperatures between 27C to greater than 29C and greater than 30C for four to five months, and less than 20C in winter (July to September). Highest average SST is predicted to be 29.64C (±PI 1.12oC) at Latitude ‑13.5o in late January; SST cools slightly towards the equator.
#4. The Southern Equatorial Current which splits to form the North Queensland current and the East Australian Current (which dissipates south into the Tasman Sea) is cooled continuously by convection, long-wave re-radiation to space by towering clouds, cool rainfall and the formation of reflective residual cirrus ice-clouds. These processes maintain SST within close limits that rarely and only transiently exceed 30oC.
#5. No difference was found between temperatures measured between Port Stephens and Cape Sidmouth in November and December 1871 and data for those times derived from AIMS datasets. Further, data does not support claims by AIMS, the Great Barrier Reef Marine Park Authority, The Australian Museum, the Great Barrier Reef Foundation and groups including WWF and the Climate Council that sea surface temperature has increased by an unremarkable 0.8oC or that continued warming is likely to threaten survival of the Reef.
#6 Near the Equator the water cycle operates as a self-regulating heat-pump that catapults moisture high into the atmosphere to form cloud that reflects or rejects incoming solar energy during the monsoon and thereby limits input of warm waters to the North Queensland and East Australian currents. There is no evidence that the process has broken-down or is likely to break down in the future.
Background
With operations in Townsville, Darwin and Perth, AIMS is part of arguably the largest, most expensive and elite conglomerate of research institutions in Australia. Spread across multiple universities and state and commonwealth agencies and with strong support from the Australian Research Council, their research focuses on the effect of climate change on Australia’s Great Barrier Reef. They and partner organisations including CSIRO and the Great Barrier Reef Marine Park Authority (GBRMPA), Great Barrier Reef Foundation, WWF and the Climate Council have consistently claimed survival of the Reef is imperiled by rising seas and anthropogenic warming. For instance, GBRMPA states unequivocally[2] that “Australia’s climate has warmed on average by 1.44 degrees Celsius since national records began in 1910, with most warming occurring since 1950 and every decade since then being warmer than the ones before”; and that “sea surface temperatures in the Australian region have warmed by around 1 degree Celsius since 1910, with the Great Barrier Reef warming by 0.8 degrees Celsius in the same period”.
Research reported here investigates that claim. The main question is:
Is mean SST increasing, and if so, at what rate.
What we did
Using average SST data from September 1991 for the fixed tide gauge at Cape Ferguson, which is part of the Australian baseline Sea Level Monitoring Project run by Australia’s Bureau of Meteorology (BoM), we aimed to distinguish between variables that caused variation IN SST from latent factors that may have impacted ON the data-stream (impact variables). Multiple linear regression (MLR) was used to investigate variation IN SST, while factors that impacted ON the data-stream were investigated using step-change analysis of MLR residuals (SST with covariable effects removed).
Commencing on 28 November 1871, SST was measured between Port Stephens and Cape Sidmouth near the top of Cape York by astronomers from Melbourne and Sydney who sailed on the Governor Blackall to observe the total eclipse of the sun and also on their return voyage commencing 13 December. They used bucket samples taken near the bow of the steamer each hour between 6 am and 6 pm each day. Data were summarised and coordinates were estimated from accompanying notes using Google Earth Pro. Although published in 1877, the data has never been used before to benchmark data collected more recently by AIMS. (National Library of Australia call number NL 551.56 R963.)
As AIMS data consisted of varying numbers of daily observations, collected using a variety of dataloggers and sensors over variable time periods, averages were calculated for 27 sites spanning the Reef corresponding to the time of the 1877 voyages and mainly at the start and middle of each calendar month. Datasets were analysed as transects using polynomial regression and compared statistically and graphically.
The Cape Ferguson, 1871 and derived AIMS SST datasets used in the study are available here .
Principal findings
Data measured close to shore was contaminated by heat transfers with the landscape. Thus, data for Cape Ferguson (and some AIMS dataloggers, notably several in Torres Strait) was warmer during dry hot summers and did not truly reflect SST.
The Eastern Australian Current warms rapidly from November to December and temperature measured on the journey to Cape Sidmouth in 1871 was significantly cooler than values for the return voyage to Port Stephens. However, despite spatial and temporal uncertainties and within and between year variation in the behavior of the currents, confidence bands for AIMS data averaged for 01 and 15 November overlapped those for the voyage north from Port Stephens and were therefore not different. Within the Latitude limits of where datasets overlap, AIMS data for 04 and 18 December, 01 January and 15 and 01 February, are also not different to data for the return voyage from 13 to 24 December 1871.
Furthermore, toward its northern extremity (Bramble Cay, Latitude ‑9.08o, for which there is no useful AIMS data), while SST increases steadily from 01 November to mid-December, from then until March, SST does not exceed between 29o and 30oC. The curvilinear response evidenced an upper-limit to SST, which is rarely or only briefly exceeded.
Average monthly SST attains a plateau in late November that persists until the cooling phase commences in March. SST in the range 27oC to 29oC from November to late March provides a five-month growing season for corals, which combined with the minimum of around 20oC in July (North Keppel Island) defines the ecotone limit of Reef ecosystems.
North Solitary Island is too cool from September to April (<24oC) for Reef ecosystems to establish and thrive. It was estimated that at Latitude -13.5o , which was the warmest point along the Reef transect, maximum SST occurred in late January to early February (29.64oC ±PI 1.12oC ), the minimum occurred in mid-August (24.26oC ±PI 1.47oC), SST increased to mid-November (27.96oC ±PI 1.1oC) after which the cycle repeats. The interannual range was therefore about 5.4oC. Despite trend in sea-surface temperature being touted as a threatening process that may ‘catastrophically’ impact on the long-term health and survival of the Reef, of the scores of sampling sites operated by AIMS, only several are dispersed towards the extremities of the Reef, while too few are sufficiently well maintained and serviced to provide reliable long-term data.
Sea surface temperatures reported by AIMS are no warmer than they were in November and December 150 years ago in 1871. As solar radiation increases in summer, SST north of Latitude -13.5o is cooled by the monsoon and remains in the range of 29oC to 30oC. AIMS SST data shows no evidence that the process has broken-down or is likely to break down in the future.
As SST has not changed, nor is it likely to change in the future, coral bleaching is due to something else.
Find out more
The page you have just read is the basic cover story for the full paper. If you are stimulated to find out more, please link through to the full paper – a scientific Report in downloadable pdf format. This Report contains far more detail including photographs, diagrams, graphs and data and will make compelling reading for those truly interested in the issue.
Observations for at least the last 50 years of open ocean surface temperature provide clear evidence that the annual average ocean surface temperature is limited to 30 degrees Celsius with short-lived excursion up to 32 degrees Celsius. This observation contradicts the predictions of climate models that show tropical ocean surface temperature perpetually rising.
The formation of clouds in response to the surface temperature of tropical oceans limits the surface insolation. Once the surface temperature reaches 32C the cloud becomes sufficiently persistent that surface heat input and heat output reach a balance. The consequence being that 32C is the maximum possible temperature of open ocean water.
The ocean surface temperature limiting mechanism is tightly linked to the atmospheric water content. Once the atmospheric water content reaches an equivalent depth of 45mm, a process of cyclic deep convection sets in whereby water vapour is literally catapulted as high as 12,000 metres into the atmosphere by convective instability. This is a well-defined physical process detailed in the paper.
The paper challenges the concept of “Greenhouse Effect” where radiating gasses such as water vapour is assumed to only cause surface heating. The key failure with climate models is the parameterising of clouds which are, in fact, formed from different phases of atmospheric water. Once the atmospheric water reaches 45mm, the mode change to cyclic cloudburst results in the atmospheric water becoming a cooling agent rather than a warming agent at lower level.
Background
The satellite era has provided abundant data with broad coverage of the global energy balance, atmospheric conditions and surface temperature. Observation of the ocean surface temperature data from satellites provides compelling evidence that the ocean surface temperature rarely exceeds 30 degrees Celsius. Rare exceptions like the Persian Gulf, which reaches up to 35 degrees Celsius, provides the key to identifying that cyclic cloudburst is a surface temperature limiting process. Cloudburst is rare in the Persian Gulf and it is the only sub-tropical ocean surface exceeding 28 degrees Celsius that has not experienced a tropical cyclone in recorded history.
What we did
In addition to the satellite data, surface level data from the tropical ocean moored buoy arrays was evaluated to observe the surface temperature limiting process in operation through one hour intervals displaying the exquisite precision of this natural atmospheric-ocean system. A series of charts within the paper demonstrates the same process across the three tropical oceans separated by thousands of kilometres and at different times of the year all regulating ocean surface temperature to a limit of 30 degrees Celsius.
A single column atmospheric model was developed through the course of this study to quantify convective instability and that led to the understanding that the increasing persistency of high level cloud reduced surface insolation by increasing cloud short wave reflection. Clear sky conditions reduce rapidly with surface temperature above 28 degrees Celsius.
Detailed analysis, month-by-month of top of the atmosphere radiation balance and the level of atmospheric water unearthed a key parameter that the role of water vapour pivots about a level of 45mm. Below that level, the water vapour is a warming agent through long-wave radiation absorption while above that level it is a cooling agent through the process of convective instability dominating cloud formation and increased cloud short-wave radiation reflection.
Principal findings
Current climate models assume the ocean surface temperature can continue to increase without constraint. Clouds in climate models are parameterised and their formation is not tightly linked to surface temperature. These fundament flaws mean climate models predict physically impossible outcomes. They are not representative of Earth’s climate system. The warming trend all climate models predict for the Nino34 region is clearly not evident in the actual recorded data over the last four decades.
Until climate models can replicate the physics of deep convection, tightly linked to surface temperature rather than the naive parameterisation of clouds, they will remain nothing more than extended weather models with useful predictive ability of a few days.
The behaviour of water in Earth’s atmosphere follows clearly defined processes that depend on the physical properties of water, in all phases, and atmospheric pressure. The only way the open ocean surface temperature can exceed 32C is through a substantial increase in atmospheric pressure. There is strong proxy evidence that higher ocean surface temperature were recorded in the Cretaceous period when the atmospheric pressure was approximately 10% higher than present time. This is consistent with the temperature limiting process detailed in the paper.
Observations of the attributes of water in the atmosphere contradict the heat trapping assumption of atmospheric water described by the “Greenhouse Effect”. Water in the atmosphere is not heat trapping but rather a temperature regulating component that increases radiating power (the sum of reflected short wave radiation and emitted long wave radiation) when the surface warms and reduces radiating power when the surface cools through reduced cloud cover enabling more surface insolation.
An important link – find out more
The page you have just read is the basic cover story for the full paper. If you are stimulated to find out more, please link through to the full paper – a scientific Report in downloadable pdf format. This Report contains far more detail including photographs, diagrams, graphs and data and will make compelling reading for those truly interested in the issue.
[1] Professional Electric Engineer consulting in engineering risk for major projects with an enduring interest in natural catastrophes and changing climate.
At what point does it become the moral and legal duty for scientists to speak out when an issue involving the integrity of science arises? This challenge has always existed but may be presenting itself in in a new light over the issue of whether sea surface temperatures near the Great Barrier Reef are rapidly rising.
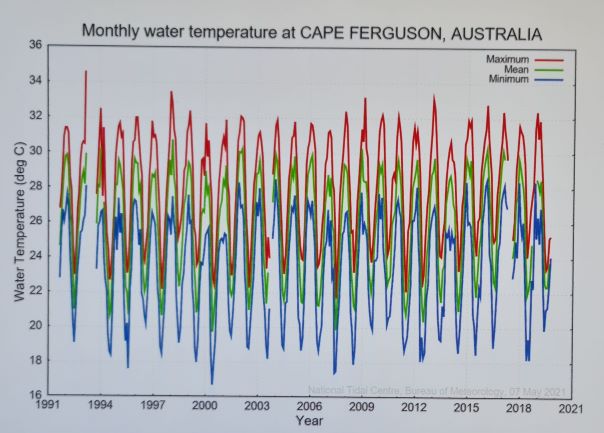
It was this challenging question that came strongly to mind when I was made aware of the two graphs shown below. The first graph is of the raw data from a sensor at the Australian Institute of Marine Science (AIMS) wharf at Cape Ferguson, not far from Townsville, Queensland. To the naked eye, and on an expanded scale, it definitely fails to show any rapid rise over the 29.5 years of observations.
Source: National Tidal Centre. Bureau of Meteorology. 07 May 2021. Australia
Using basic statistical methods, if one digs deeper into the table of data supporting the graph the answer comes back the same – ‘No.’
After reviewing the Cape Ferguson data, natural resources research scientist Bill Johnston found a connection between sea surface temperature measured by the tide gauge and maximum temperature measured on-land but no evidence of a trend uniquely due to warming of ocean waters in the vicinity of Cape Ferguson.
‘If the numbers at Cape Ferguson are supposed to constitute part of the evidence for rapidly increasing sea surface temperatures in the vicinity of the GBR, they just don’t stack up,’ says Dr Johnston. ‘If a rapid rise exists, we are going to have to look much further afield for the compelling evidence than just a wharf near the shore of the mainland.
‘And if we go looking for the real evidence, we are going to have to find some obvious and sustained increases elsewhere in the Reef and its lagoon to compensate for the absence of an ocean-related trend at Cape Ferguson,’ he says.
The second graph shows Johnston’s work in ‘de-seasoning’ the annual swings in measured temperature due to the difference in the Sun’s apparent position north and south of the Equator. When the sun appears to be directly overhead, it is hotter, the days are longer and the water near the surface is warmer. When the angle of the Earth’s tilt makes the Sun appear to move north of the Equator, the reverse is the case – less solar heat, shorter days and cooler water. The annual swing in sea surface temperature is constant and not attributable in any way to changes in the climate.
Source: Scientist Dr. Bill Johnston
Dr Johnston’s analysis of the de-seasoned data shows two clusters of warmer temperature (1998 and 2018) but no indication that sea surface temperatures are increasing rapidly or likely to increase in the future.
The commonly held view that sea temperatures are rising in the GBR is widespread and the message is deeply entrenched, so much so that the topic is an almost guaranteed dinner-party-wrecker if seriously disputed by any of the guests.
But is it true?
The problem for our dinner party is that, like it or not, a clear-headed review of the observed sea surface temperatures in the GBR shows no rising trend in the data – at least not at Cape Ferguson. Most importantly, there is no such phenomenon in the data that would justify the use of the word ‘rapidly’.
So what is the duty of an ethical scientist at the dinner party in this situation – to wreck the party or just to stay quiet and avoid rocking the boat? What is the scientist’s obligation to draw people’s attention to the discrepancy between belief and reality? This is possibly one of the oldest challenges in science.
‘At Cape Ferguson, there is a huge disparity between what people – and scientists – seem to believe and what the data says,’ says Johnston. ‘True scientists should not sit back and allow this misconception to take hold in the public mind as the truth.’
While Cape Ferguson is a single instance, other sites around the GBR show the same inconvenient result. The AIMS site at Thursday Island, off the tip of Cape York (May 1998 to February 2019); Arlington Reef off Cairns (April 1996 to February 2020); Seaforth Island off Proserpine (July 2005 to February 2021) and Square Rocks off Yepoon show no discernible warming trend. It seems to be the truth that over-hyped talk of rapid rise in sea surface temperature is belief-based, not fact based.
Someone of influence and repute needs to start blowing the whistle on this.
The data for Cape Ferguson is available from the Australian Bureau of Meteorology (BOM) website ( http://www.bom.gov.au/oceanography/projects/abslmp/data/monthly.shtml ). The site is one of National Tide Centre’s Australian Baseline Sea Level Monitoring Project (ABSLMP), a unit within BOM. ABSLM monitors seal level and sea surface temperatures at 16 sites around Australia and data can be viewed as PDF graphs and as tables. Please have a look for yourself. I stress this request, please look for yourself and don’t just take my word for it. You just may be shocked by the disparity between the general belief and the reality revealed by the data. Please also bear in mind that the data you will find is not the work of some hair-brained contrarian sitting at a computer late at night, blogging away madly and making it all up. It is the data from the Australian Baseline Sea Level Monitoring Project (ABSLMP).
I will deal with more of this data in greater detail in subsequent articles to be published on http://www.bomwatch.com.au
For the moment however, let me just focus on the Cape Ferguson site at the AIMS wharf which is part of the baseline monitoring program referred to above. While AIMS is not directly responsible for the collection of the data (it is done automatically) the sensor is co-located at its property and, given the marine science role of AIMS, one might expect that the organisation might have more than a passing interest in the integrity of the Cape Ferguson data.
It’s all a bit disheartening. Very few individuals appear ready to acknowledge that they may be under a moral or legal obligation to speak out about the chasm between belief and empirical data when it comes to sea surface temperatures near the Reef.
There is a further question that opens out from this. At what point do we expand the idea of a personal moral or legal duty of an individual to the wider scope of the legal duty of a corporate entity such as a university or publicly funded research organisation? Not only is it intolerable that individual scientists may avoid their moral and legal duty, it is also intolerable when a corporate entity does the same.
Research organisations we have come to trust cannot be granted the luxury of legal immunity when they make claims that cannot be substantiated. They cannot choose to remain silent when challenged by obvious discrepancies.
I opened this essay by posing the question about when a scientist’s personal moral or legal duty to speak-out clicks in. The disheartening thing is that this point of law is not yet clearly determined and the law seems more porous on this subject than it does in, say, the commercial world where an individual makes a false or misleading statement about the contents of a prospectus when promoting that prospectus. Similarly, a company – a corporate legal entity – faces severe legal sanction if it issues a false or misleading prospectus.
Let’s hope the persistence of scientists like Dr Bill Johnston gives heart to others to speak out when they see instances like Cape Ferguson. Our systems of quality control in science need teeth, not more funding for flawed science based on foundations of wrong, or shaky, data.
<end notes>
David Mason-Jones is a freelance journalist of many years’ experience. He has researched and written extensively on environmental issues. www.journalist.com.au or publisher@bomwatch.com.au
Dr Bill Johnston is a former NSW Department of Natural Resources senior research scientist and former weather observer. scientist@bomwatch.com.au