Category Archives: Bureau of Meteorology

Cape Leeuwin, Western Australia

Part 2: Issues affecting performance

 Dr. Bill Johnston[1]

Synopsis

AWS data for Cape Leeuwin don’t reflect the weather and are unlikely to be useful for detecting trends and changes in the climate.

Background

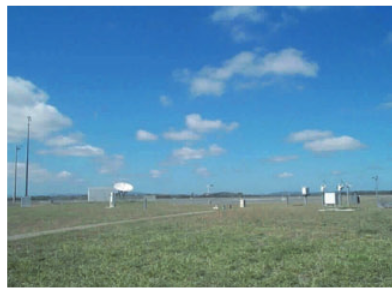
Being the longest single-site temperature and rainfall record in Western Australia, the automatic weather station (AWS) at Cape Leeuwin is regarded as one of the most important in the Bureau of Meteorology’s AWS network (Figure 1). However, situated at the southwest extremity of the continent, of all the Bureau’s weather stations, it is also one of the most exposed.  

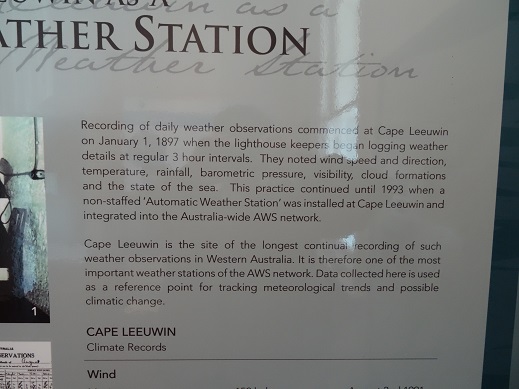
Figure 1. Signage at Cape Leeuwin explaining the importance of the automatic weather station.

Cape Leeuwin’s rugged rocky headland marks the junction of the Indian and Southern oceans. Cold, sub-polar low-pressure systems sweep in during winter and the sub-tropical high-pressure belt squeezes them south in summer. As there are no obstacles south or west to break-up or divert the low-pressure troughs, associated frontal systems and often gale-force winds; Cape Leeuwin experiences some of the most intense weather systems affecting mainland Australia. (BJ photo.)

While the general circulation moves from west to east at a rate of about 650 km/day, the mid-latitude belt of high-pressure shifts from around -40o Latitude (the Latitude of Flinders Island in Bass Strait) to around -30o Latitude (about the Latitude of the NSW-Queensland border) in April and back again around early October. This N-S seesaw, which follows the sun, is the reason Australian climates are strongly seasonal (moist during winter in the south when low pressure systems prevail and moist in the north during summer due to intrusions of the tropical monsoon and vice versa).

Weather-watches know that when the sub-tropical ridge settles a few degrees further south in winter, say south of Dubbo (-32o Latitude), approaching low pressure systems are also forced south and southern Australia is drier than normal and vice versa. Similarly, the position of the high-pressure ridge in summer determines the southern reach of the monsoon.

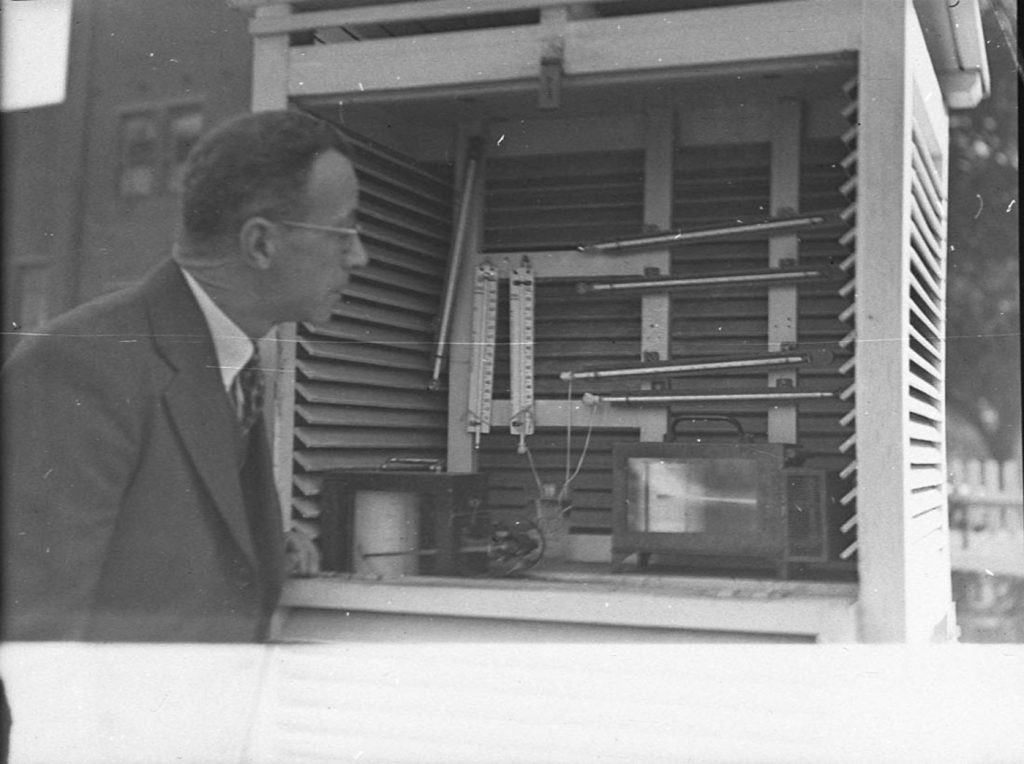
Observing the weather in situations that are open and exposed, subject to wild fluctuations, extremely strong winds and heavy seas is a challenging occupation, especially when manual observations were made at regular intervals both day and night. Wind was so strong and unrelenting that it shook the Stevenson screen, reset thermometers and resulted in breaks in their mercury and alcohol columns (Figure 2). It also drove mist, fog, rain and sea-spray into the screen, wetting instruments and interfering with measurements which are assumed to be dry-bulb.

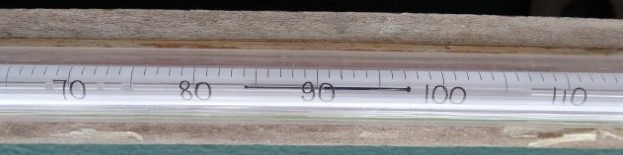
Figure 2. A Fahrenheit meteorological minimum temperature thermometer showing breaks in the alcohol column (adjacent to the 68o, 73o and 75oF indices). Drawn down by the meniscus (sitting at 106.8oF) the metal bar marks the lowest reading of the day (97.3oF in this case). Not shown is a large vapour break in the lower stem of the thermometer, which after four decades of storage rendered it unserviceable. The interval scale in the photograph is magnified by about 50% compared to the actual scale, which was about 2.5 mm (1/10th of an inch) per interval. (BJ photo.)

Minimum temperature observations were noted as problematic in 1916, but the problem was not specified. The original Stevenson screen was an ‘old observatory pattern’, which by 1926 had been lowered to within 2 feet of the ground apparently to reduce wind-shaking. A decade later in June 1936 a new screen was installed; but was it in the same place or did the site move? Then no news about the state of the screen or the condition of the instruments for 28 years – until July 1964, when it was reported that the door, which faced south into the weather was damaged. No news also for the 14 years before the site moved in October 1978. Perhaps by then the screen was neglected like the one in Figure 3.

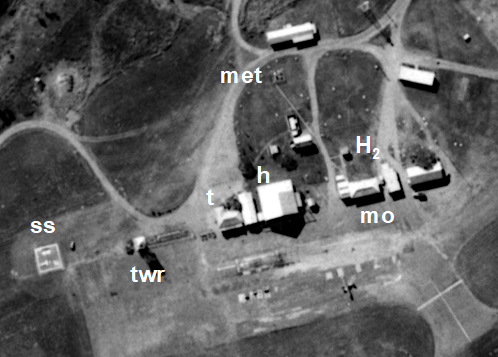
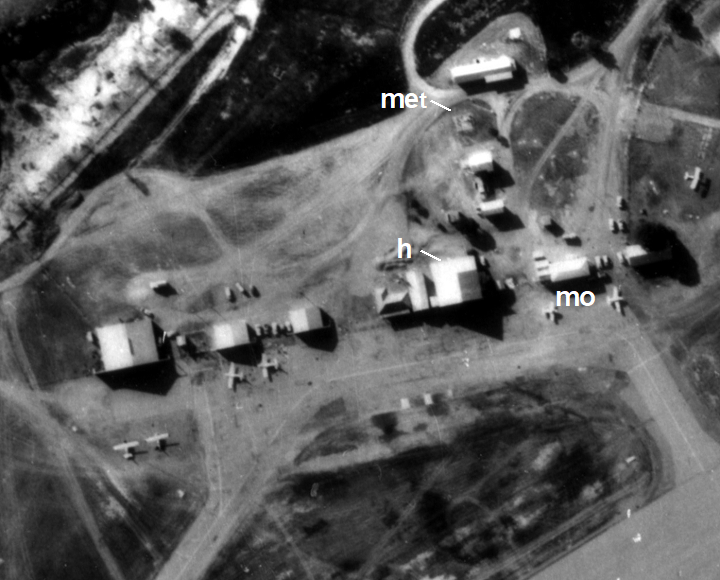
Despite repeated assurances that Australian Climate Observations Reference Network – Surface Air Temperature (ACORN-SAT) sites like Cape Leeuwin were well researched and peer reviewed, metadata is poor to non-existent. Peer-reviewers did not investigate if documentation was adequate, or if sites were well maintained and data were fit-for-purpose. It is not that long ago that the site moved in October 1978 but site summary metadata miss-specified its previous location and did not report the move. Apparently the Bureau had no records or photographs or files. However, a 1950s plan in a file at the National Archives of Australia unequivocally showed the ‘wind gauge’ northwest of the lighthouse and the Stevenson screen northeast (Figure 4) where it was also visible in photographs taken in 1975.   

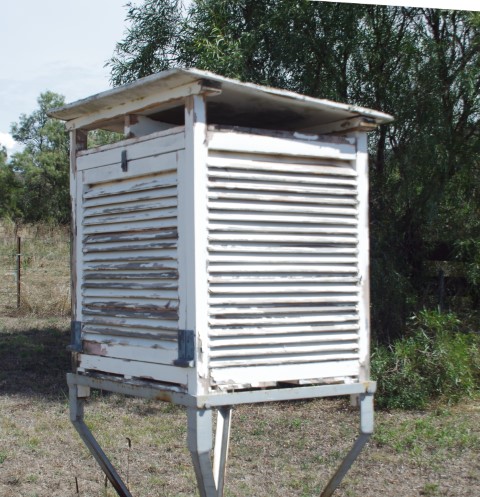
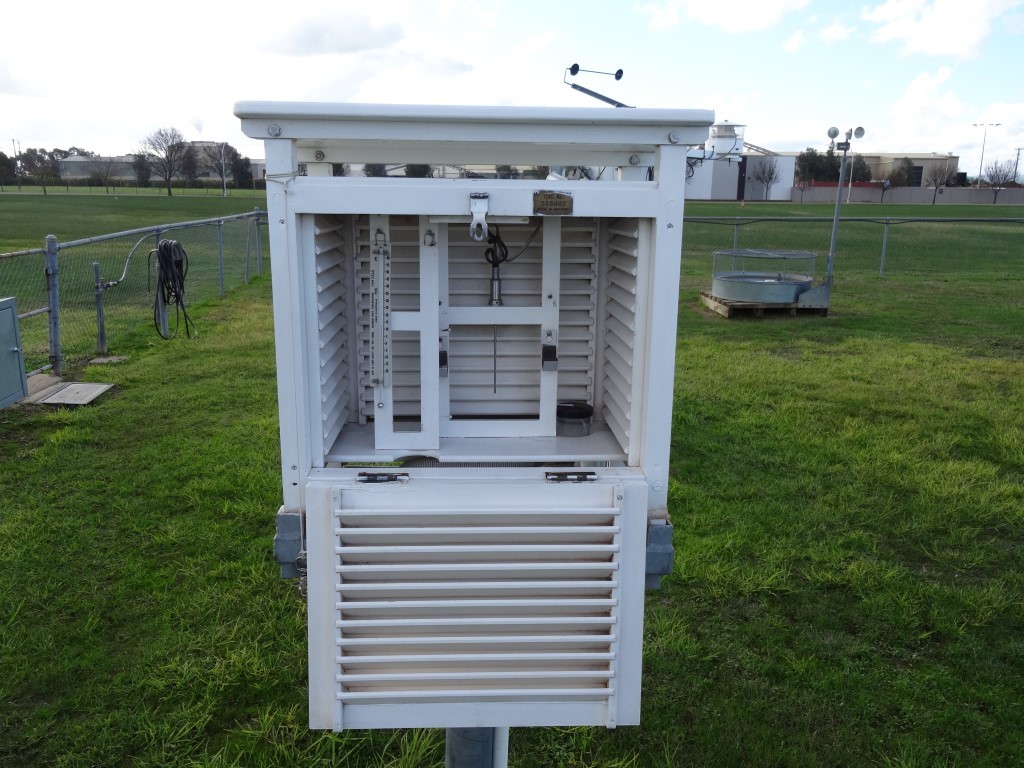
Figure 3. A neglected 230-litre screen no longer in use at an agricultural research centre in NSW. (BJ photo.)

The importance of metadata cannot be understated. Scientists say that if sites and instruments remained the same, changes in the data are attributable to the climate. Ignoring (or not documenting) changes that happened or adjusting data for changes that had no impact (or using unspecified, unreplicable statistical tests to make adjustments) is one way to create pre-determined trends. Subjective homogenisation methods based on faulty metadata are unscientific; they result in trends that have nothing to do with the climate and should be abandoned.

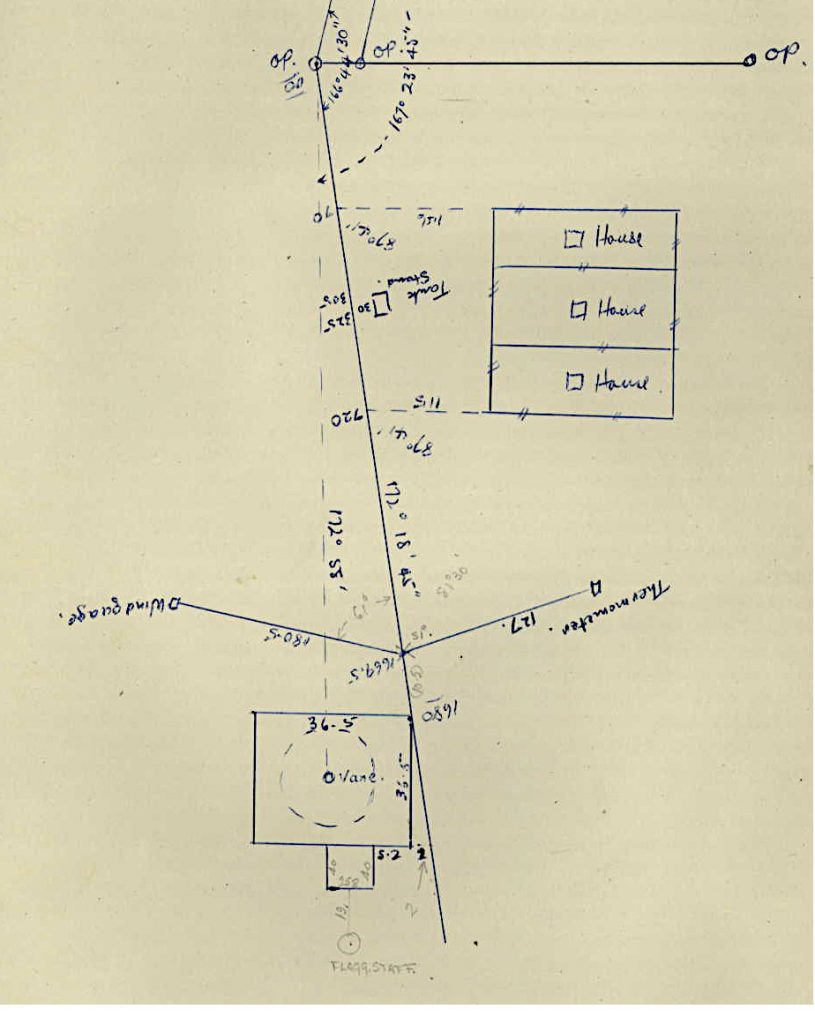
Figure 4. Page 104 from file ‘Cape Lewin (Leeuwin) – transport lighthouse’ National Archives of Australia Barcode 1929975; showing location of the wind vane (anemometer) and Stevenson screen, which was about 38 m east of the path.

Using Cape Leeuwin as a case study, the physically based reference frame outlined and demonstrated in Part 1 of the series is applied to the problem of exploratory data analysis (EDA) – the rapid assessment of AWS datasets used to construct daily temperature maps and to homogenise ACORN-SAT data used to calculate Australia’s warming. The approach was developed from previous original research published on http://www.bomwatch.com.au In line with the theme of “Are Australia’s automatic weather stations any good?” this paper outlines an EDA methodology that can be applied by climate scientists to investigate the fitness of individual datasets for determining trend and changes in the climate.   

The approach uses Pearson’s linear correlation coefficient (r) to measure the strength, significance and sign (+ or -) of the association between mean maximum temperature (Tmax) and its expected deterministic covariable, rainfall; and non-parametric LOWESS regression (LOcally Weighted Scatterplot Smoothing) to visualise the shape of the association, the spread of values about the line and identify outliers relative to 95% bootstrapped confidence intervals for the fit.

Leaving aside problems evident in data from 1907, which were also investigated; the AWS, which commenced operating in February 1993, was moved from a relatively sheltered position between two sheds to an up-draft zone closer to the 13 m drop-off above the ocean in April 1999. Corresponding with the move, rainfall-catch abruptly declined by 26%. Mean Tmax at the new site was biased high relative to pre-1993 manual data and although not significant, Tmax implausibly increased with rainfall. Seven of 27 datapoints were identified as outliers including 2011 (21.20oC) and 2012 (21.13oC), which were an unlikely 1.61oC and 1.53oC higher than pre-AWS Tmax (19.6oC).  

It was concluded that as AWS data don’t reflect the weather they are unlikely to be useful for detecting trends and changes in the climate.

An important link – find out more

The page you have just read is the basic cover story for the full paper. If you are stimulated to find out more, please link through to the full paper – a scientific Report in downloadable pdf format. This Report contains far more detail including photographs, diagrams, graphs and data and will make compelling reading for those truly interested in the issue.

Click here to download the full paper including photographs and tables of data

(In line with our open-data policy, datasets used in the study are provided in Appendix 2 (pp. 11-16).)

We also welcome comments on the methodology.


[1] Former NSW Department of Natural Resources research scientist and weather observer.

Amberley, QLD. Case study

Part 1: A robust fitness test for maximum temperature data

Dr. Bill Johnston[1]

Synopsis

The first post in this series about the reliability of automatic weather stations (AWS) provides physical justification for using the First Law of thermodynamics as the reference frame against which weather station data may be assessed. While advection warms the air, which increases maximum temperature (Tmax), latent heat removed by evaporation of rainfall is locally cooling. The First Law theorem predicts a dynamic balance between average annual Tmax and annual rainfall, which is evaluated statistically.

Adopting Amberley RAAF as the case study, analysis of Tmax ~ rainfall residuals identified non-rainfall changes that impacted on trend; while statistical significance and variation explained objectively measured overall conformance with the First Law theorem. Analysis of Tmax for six other sites showed the methodology was robust, replicable, widely applicable and therefore useful for benchmarking the operational performance of Australia’s automatic weather station network.

Data are coarse and all sites were poorly documented. Incomplete and misleading metadata, inadequate site control and biased homogenisation methods undermine claims that Australia’s climate has changed or warmed. 

Background

With their current focus on climate warming, climate scientists need robust quality assurance methods for verifying that maximum temperature data (Tmax) used for testing hypothesis about the historic and contemporary climate and its possible changeableness going forward are fit for purpose. Although thousands of datasets are potentially accessible not all are equally useful. The question examined in this series of posts about automatic weather stations is: are their data fit for the purpose of determining change or long-term trends; or are they only useful for monitoring day-to-day weather?

The problem

Since the 1990s Australia’s Bureau of Meteorology has all but abandoned its monitoring network.  Met-offices like at Ceduna, Oodnadatta, Cobar and Mildura sit empty; some like Hobart and Sydney Observatory have been sold or re-purposed, while others like Coffs Harbour, Albany, Canberra, Tindal and Mount Isa have been demolished and removed. Rapid-sampling platinum resistance probes have replaced thermometers, automatic weather stations have replaced observers and 230-litre Stevenson screens used to house instruments, have been replaced by 60-litre ones with that program accelerating over recent years. Due to their restricted capacity to buffer against transient eddies; the 60-litre screens are likely to be biased-high on warm days (Figure 1).

Sensitive instruments housed in 60-litre screens, which are hard-wired to the Bureau’s computer in Melbourne is a potent source of on-going bias. Neighbouring sites that have changed to AWS more or less in unison used to cross-validate and adjust each other’s data in real-time, reinforces rather than adjusts potential errors and embedded anomalies. Its unlikely for example, that data for any sites are truly independent and it is likely that the combined behaviour of infrequently maintained unmanned sites operating with small screens enhances warming. There are other problems too including the propensity for 1-second observations to report random spikes – flurries of warmer air rising from pavements or created by vehicles or people going past. Of the 86,400 one-second values recorded by an AWS each 24-hours, only two of those carry forward as data – the highest is the maximum for the day and the lowest is the minimum.   

Error control using cross validation also requires that neighbouring site data be of acceptable quality and unaffected by parallel non-climate effects, which is impossible to gauge from an office hundreds or thousands of kilometres from the site.

Figure 1. Internal view of the large Stevenson screen at Sydney Observatory in 1947 (Top above, black and white image) and the small screen at Wagga Wagga airport in June 2016 (lower above, colour image). While thermometers in the 230-litre screen are exposed on the same plane, the electronic probe at Wagga Wagga is placed behind the frame about 2 cm closer to the rear of the screen, which faces north to the sun. According to metadata, the 60-litre screen at Wagga Wagga was installed on 10 January 2001 and although thermometers were removed on 28 April 2016 intercomparative data is unavailable.

The burning question is whether data reported by AWS reflect the change in screen size (60-litres vs. 230-litres), behaviour of the electronic instrument (vs. observed thermometers), conversion of electrical resistance to temperature (calibration error), data processing (detection and filtering of erroneous values; averaging; cross-validation); reduced site control and maintenance (grass mowing, cleaning equipment etc.); the climate, or something else.

The First Law Theorem

The First Law of Thermodynamics, which is a universal theorem, is used a reference frame for assessing the fitness of maximum temperature (Tmax) data. Data are expected to behave rationally and not in some random, chaotic way and the methodology outlined in the following posts has been devised to test and evaluate conformance with the theorem. Using Amberley RAAF as a case study, the first paper in this series outlines the physical basis underpinning the approach. Six widely dispersed airport sites were also analysed to replicate and verify that methods are robust and widely applicable. Subsequent posts will evaluate AWS datasets from across Australia and those for sites in the vicinity of capital cities.

As droughts are always hot and dry, and rainy years mild and moist, lack of negative correlation between Tmax and rainfall; low explanatory power (variation explained); confounded signals and weird values – high Tmax in rainy years and vice versa, are causes of concern.

The First Law theorem provides a rational basis for determining if Australia’s automatic weather stations are any good, or if the data they produce consists of incoherent random numbers that bear little relationship to the ‘real’ climate.

An important link – find out more

The page you have just read is the basic cover story for the full paper. If you are stimulated to find out more, please link through to the full paper – a scientific Report in downloadable pdf format. This Report contains far more detail including photographs, diagrams, graphs and data and will make compelling reading for those truly interested in the issue.

Click here to download the full paper including photographs and tables of data


[1] Former Senior Research Scientist. Email: scientistATbomwatch.com.au

On Peer Review

by David Mason-Jones

A limited tool at best – never a proof  

Many people may have a mental image of peer review as a process where white-coated scientists re-run the experiment in laboratories or repeat the research out in the real world.

After this they have long meetings in board rooms to discuss the paper and, finally, they confirm that the research and results described in the paper are rock solid and beyond doubt. They then approve the paper for publication in a journal.

The belief in peer review as proof of scientific fact becomes conflated with concepts like truth, beyond doubt, trustworthy, reliable, beyond dispute, the gold standard of science and so on. Sadly, for people who hold these beliefs, peer review is nothing of the sort. 

So, what is peer review?

Peer review is a step in the publishing process where an editor/publisher attempts to weed out papers that are spurious or obviously in error. It is a process where papers are vetted to ensure they present a cogent argument based on recognized scientific analysis. 

At a superficial level peer review can be as simple as a spelling or syntax check, that scientific terms are correctly used and that the paper reads okay. This might sound lightweight for a journal at the forefront of scientific knowledge but presentation is important. 

This part of the process can also include checks on the visual aids used in the paper such as photographs, diagrams, graphs and tables. Are these clear and understandable? Do they support the points made in the body of the paper? Are they relevant or do they just look good?

At a deeper level the peer review process addresses issues like: ‘Is the hypothesis sound and relevant and is it supported by the Introduction?’ Is the logic of the paper sound? Are the methods sound? Do they relate to the hypothesis? Is the argument well constructed, brief and to the point? Is there anything missing in the chain of logic? Does the paper present new information or does it support existing knowledge?

Peer reviewers are appointed by the editor and most scientific journals are quite specialized as to the field of science upon which they are writing, so reviewers need to confirm whether the paper satisfies the scape of the journal.

Given that there are many different journals and editors, it becomes likely across the spectrum that there can be different standards and requirements as to what the editors and publishers require. It is fair to say the term ‘peer review’ has taken on a life of its own, free from real meaning and certainly not a re-running of an experiment.

Not a proof

Peer review is not intended as proof and yet peer review is trotted out all the time as the gold standard of scientific proof.

The ‘proof’ or disproof of the findings of the paper comes when it is put under the blowtorch of criticism of the wider scientific community and, most importantly, when it is put under the blowtorch of Test by Replication. 

Peer reviewers are not claiming they have done the experiment again or made the same observations or done the same maths and obtained the same results. They are not claiming to have replicated the research. This is a really important point.

Behind closed doors

There can be an area of grey when it comes to the transparency of the peer review process because the peer reviewers can choose to do their work anonymously. This conflicts with a characteristic of the scientific method which requires that science be open.

It is true that this anonymity aspect is not always the case and reviewers can choose to be anonymous or open. Despite this discretion, it is common for peer the peer review process to be dome behind closed doors. Where this happens, the peer reviewers are simply put in a position where their background, track record, expertise and even their strongly held opinions cannot openly be taken into account. The peer reviewer may simply be prejudiced against the thesis of the proponent and, by exercising this prejudice discretely and anonymously, can stymie the publication of a paper that is otherwise a valuable contribution.  

Usually a paper would have two or three peer reviewers and the writer – the proponent – has the right to contest the comments coming back to the editor from the reviewers. But where the reviewers remain anonymous, it just makes an open scientific discussion harder. 

Conflating peer review with proof – an example

An example of the conflation of peer review with proof came with an ABC Television Media Watch segment some years ago. Not only were the two concepts conflated, but the high profile Reef scientist, Ove Hoegh-Guldberg, Ph.D., Professor of Marine Science, University of Queensland, gave a ludicrous analogy of the credibility of peer review.

      Hoegh-Guldberg was quoted as asserting that the idea that reef science can’t be trusted because it’s only peer reviewed, was, ‘… just ridiculous.’ 

Hoegh-Guldberg was then cited as saying that peer review was, ‘… the same process we use when we’re studying aeronautics, which produces planes that we travel on …’

On first hearing this it sounds like a compelling analogy. But think it through. There is no way an aeronautics engineer would accept something say, a new alloy for inclusion in an aircraft design, on the basis of peer review alone. The engineers would go for the higher standard of replicability. The alloy would be tested to destruction many times in a process of replication over and again to see if it stood up to the claims made about it.

The engineers would depend on three things; replication, replication, replication.

Replication, not peer review, would be the key to the proof.

Weeding out fraud, spoofing, dumb errors

In its quality control aspect, peer review might be able to weed out totally spurious papers, rants by complete cranks, fraudulent works, mathematical incompetents, mischievous papers by tricksters and even April Fools’ Day jokes. It is not, however, even guaranteed to perform that role very well.   

Vulnerable to spoofing

A recent hoax involving peer review was first reported in ‘The Times’ newspaper in the UK and subsequently reprinted in ‘The Australian’ newspaper on 9th January, 2019. The journalist, Rhys Blakely, is The Times science correspondent and the article in The Australian is headlined, ’Academic faces sack over hoax that fooled academic journals.’ The article outlined the plight of Peter Broghossian, an Associate Professor of Philosophy at Portland State University in Oregon, USA, who is facing the university’s censure over his role in the well-intentioned hoax.

Led by Broghossian, several academic wags spoofed the peer review process and wrote 20 spurious papers, all of which had the trappings of serious scientific papers. They submitted them to academic journals for publication. The papers were meaningless rubbish but that is not the way the peer reviewers saw it. Of the 20 bogus papers put out to peer review, seven were accepted for publication – that is 35% of the total!

Dr. Broghossian and his colleagues were shocked by the ease with which the papers were accepted. Although it may have been a hoax, it confirmed peer review is not the robust gatekeeper of truth that many people believe.

Another example 

This involves papers written by research student, Oona Lonnstedt, who conducted research at James Cook University and gained a Ph.D. at the Australian Research Council Centre of Excellence for Coral Reef Studies. Lonnstedt then went back to Sweden where she did the further research which has tripped her up.

The paper which set the suspicions running was at Uppsala, Sweden. It was about the effect on small fish of ingesting ocean micro plastics and how this affected the ability of the fish to grow, hunt and survive. The paper was published in the high profile journal ‘Science’ in 2016, and was challenged by two concerned scientists within a week of publication. The challenge came after the paper had been peer review.

Lonnstedt’s paper has been examined by Uppsala University and been retracted. The report of the University’s Board for Investigation of Misconduct in Research was published in December, 2017, and found that Lonnstedt had fabricated data. Both Lonnstedt and her supervisor were found to have engaged in research malpractice.

Another body in Sweden, The Central Ethical Review Board, found that Lonnstedt and her supervisor had committed scientific dishonesty.

Again, it is noteworthy that the peer review process did not detect the issue of scientific dishonesty in this case.  

Resplandy et al, 2018

The case of Resplandy et al, 2018, also illustrates the unreliability of peer review. This paper was published in the prestigious journal ‘Nature’ in 2018. (Resplandy et al, Quantification of ocean heat uptake from changes in atmospheric O2 and CO2 composition).

Upon publication it soon became evident to certain readers that there was fundamental flaw in the analysis. The flaw multiplied the degree of uncertainty on the paper so much that, even after a correction had been made, the publishers eventually decided that the paper could not be allowed to stand and was retracted.

It is interesting that the first reader to raise the alarm was not a marine scientist, nor a climate scientist, nor a person with a Ph.D. Rather, he was a analyst in the finance industry and this shows that one should not be intimidated by a host of ‘experts’ who have peer reviewed a paper.

Retraction Watch

Retractions of peer reviewed are not rare and I invite you to visit the Retraction Watch website https://retractionwatch.com which commenced in 2010. At the start, the founders knew that retractions were happening on a regular basis but wondered if there would be enough to sustain a website. They thought they might have been able to identify around 80 cases in the first year but, in the event, they found over two hundred. 

The rate for Retraction Watch has continued unabated. As of January, 2020, the site has reported on 21,792 retractions. All of these had been peer reviewed prior to publication.

Conclusion

The belief in peer review as proof of scientific fact is false. The flip side of this belief – that the lack of peer review shows a paper is untrue – is also false.

Peer review is not a proof of anything and is not intended to be. It is vulnerable to fraud, hoaxes, spoofing and simple errors of maths. Peer review is not a replication of the original experiment or research.

NSW Bushfires 2019-2020

Submission by Dr. W.H. (Bill) Johnston

Terms of Reference for the inquiry were: (https://www.nsw.gov.au/nsw-government/projects-and-initiatives/make-submission-to-bushfire-inquiry/nsw-independent)

The Inquiry is to consider, and report to the Premier on, the following matters.

  1. The causes of, and factors contributing to, the frequency, intensity, timing and location of, bushfires in NSW in the 2019-20 bushfire season, including consideration of any role of weather, drought, climate change, fuel loads and human activity.
  2. The preparation and planning by agencies, government, other entities and the community for bushfires in NSW, including current laws, practices and strategies, and building standards and their application and effect.
  3. Responses to bushfires, particularly measures to control the spread of the fires and to protect life, property and the environment, including:
    • immediate management, including the issuing of public warnings
    • resourcing, coordination and deployment
    • equipment and communication systems.
  4. Any other matters that the inquiry deems appropriate in relation to bushfires.

Forty-four post-1910 daily rainfall datasets extending from Mallacoota (Vic.) to Yamba Pilot Station were summarised and examined; a select group of 10 from southeastern NSW and the Central Coast were analysed and from them, four or five were used to support the submission. 

A monthly water balance was used to identify long-term sequences of dry years. Drought sequences were also identified using stream discharge data for two unregulated streams in the Bega Valley. 

When efforts were made in 2013 to get hazard reduction action near our farm at Bemboka, contradictory sections of the NSW Rural Fires Act (1997) proved to be insurmountable. As the landscape continued to dry it was never a question of if but of when calamity would strike.

While the situation deteriorated and despite repeated warnings, the local Regional Advisory Committee and those in charge at Bushfire-HQ sat on their hands; paralysed by inaction. The Tathra fire in March 2018 was a wake-up call but no-body was awake. Local greenies blamed it on the climate, but it was failing electricity infrastructure. The rest is history … look over there; blame the Prime Minister …

From Gippsland to the North Coast of NSW and southern Queensland, irrespective of whether fires were deliberately lit or not, it can be fairly said the calamity of the so-called Black-summer bushfires resulted from a lack of appreciation of the emerging ‘big-picture’ threat; and of government policy and bureaucratic failures, not the climate.  

An important link – find out more

The page you have just read is the basic cover story for Dr. Johnston’s full paper. If you are stimulated to find out more, please link through to the full paper – a scientific Report in downloadable pdf format. This Report contains far more detail including photographs, diagrams, graphs and data and will make compelling reading for those truly interested in the issue.

Click here to download the full paper including photographs and tables of data used

4. Rockhampton, Qld

Dr. Bill Johnston[1]

 Main Points

  • Aerial photographs and archived plans and documents unequivocally show the Stevenson screen at Rockhampton airport moved about 450 m from beside the northern boundary of the aerodrome to a mounded site south of the runways before May 1956. The move was not reported in site-summary or ACORN-SAT[2] metadata and the substantial change in exposure appeared to have been adjusted-out of the data using parallel observations that continued possibly until the 1960s.
  • A satellite communications unit (SatCom) installed within 25 m of the second site in 1986/87 caused maximum temperature to step-up 0.48oC. Also undocumented by metadata, the abrupt increase was ignored to imply it was due to the climate.
  • The cause of an upward step-change in 2013 (0.95oC) was not specifically identified. However, as it was not related to site changes or the climate, it was either due to a local instrument fault or a problem with off-site data processing. Everything considered, it could not be ruled out that recent data were manipulated so daily maximum temperatures appeared warmer by up to 2.2oC on warm days.
  • Adjusted for rainfall, site-related changes caused Tmax to warm 1.44oC overall and after step-changes and rainfall were accounted-for no unexplained changes or trends remained that could be attributed to the climate. 

Background

The Rockhampton airport weather station (ID 39083) is an Australian Climate Observations Reference Network – Surface Air Temperature site used to estimate Australia’s warming. As is the case for other ACORN-SAT sites, since the early 1990s when they commenced homogenising Australian temperature data, Bureau climate scientists have claimed repeatedly that site-histories used to pinpoint changepoints and make adjustments were exhaustively researched. However, to their discredit, like at Cairns and Townsville, they ignored that the original meteorological enclosure at Rockhampton (Figure 1) moved about 450 m south to a substantially different exposure before May 1956. Furthermore, it appears the effect on data was adjusted-out using parallel observations that continued possibly until the 1960s.

As if to blame the climate, Bureau scientists also ignored that a satellite communications module (SatCom) installed close to the second site in 1986/87 (Figure 2) caused mean annual maximum temperature (Tmax) to abruptly step-up 0.48oC from 1987.


Figure 1. (Left) The original Rockhampton weather station (met) was located was located on the northern boundary of the aerodrome behind the Aeradio office (mo), which was established by Amalgamated Wireless Australasia on behalf of the Civil Aviation Board in 1939. Other buildings shown in the May 1956 aerial photograph were H2, the hydrogen generator for filling balloons used to estimate windspeed and direction; (h) the pre-WWII hanger, (t) the terminal, (twr) tower and signal square (ss) used for visual communication. Although Bureau staff moved to the new control tower complex in 1961, the met-enclosure was still maintained until at least June 1966 (right).    

A step-change in 2013 (0.95oC) was not related to the climate but was caused by over-reporting of high-range daily values. The change appeared to have coincided with the AWS being hard-wired to the Bureau’s computers in Melbourne where data were processed into daily maxima, minima and 10-minute and half-hourly observations. As the Stevenson screen had been changed from 230 to 80-litres well before (on 22 March 2000) and no site changes were evident in satellite images; it was highly unlikely that while distributions of upper-range minimum temperatures (daily Tmin >18oC) were cooler after 2013, the highest 10% of daily observations (Tmax >33oC) were warmer by up to 2.2oC.

Further, while the record-highest temperature on 18 November 1990 (45.3oC) occurred before the site moved away from the SatCom and should be disregarded, it is implausible that the second highest value of 44.4oC on 28 November 2018 was 2.7oC over-range relative to the percentile distribution of pre-2013 data.

Although evidence was circumstantial, either the instrument, including its calibration was faulty or the problem occurred during processing. Given there were no parallel observations or a paper-trail, and bearing in-mind the Bureau’s penchant for declaring daily, monthly and annual ‘records’ somewhere almost every day, it cannot be ruled out that data were jigged higher on warm days.

Click here for full paper, photographs and tables of data.

Discussion

Moving a weather station is not a simple matter and it is not possible that the pre-1956 move was not recorded in Bureau files. It required negotiation with the Royal Australian Air Force and the Department of Civil Aviation; recommendations and approvals of expenditure at Director level; requisitions to the Department of Public Works (Cwth) for building the mound and installing equipment and it may have taken months to complete. Following the move parallel observations were made for several more years. Adding to the debacle, it appears data were changed to hide the move, which further undermines trust in the integrity of the Bureau’s data management processes.

Figure 2. An undated oblique view of the Rockhampton weather station and large SatCom dish copied from a 2011 ACORN-SAT Station catalogue (left); and (right) the same site from a different perspective copied from the most recent catalogue. Installation of the SatCom in 1986/87 caused maximum temperature to step-up 0.48oC.   

It is also not possible that observers were unaware that the SatCom was installed 20 to 30 m from the previous site in 1986/87 or that it generated heat that affected measurements. Also perverse is that the 1987 step-change, which was highly significant in both time and rainfall domains, was not detected or adjusted by data homogenisation. Likewise, multiple analyses of the 2013 step-change found it was due to either an instrument fault or off-site data processing, not the climate.

Despite at least four homogenisation iterations of the same data, failure to detect and adjust the 1987 step-change exposed major weaknesses in the Bureau’s methods. Homogenisation lacks scientific objectively, rigour and oversight; while picking and choosing changepoints and applying arbitrary adjustments allows changes and trends in homogenised data to be pre-determined.

Finally, at all levels (publication in scientific journals; the Bureau’s annual climate statements and reviews; CSIRO’s State of the Climate reports, supporting documents and advice to governments; grey-science news stories spread by the Climate Commission, the Conversation, the Climate Council, WWF and the ABC, in-house reviews and ‘independent’ technical audits) the peer-review process failed dismally to detect problems and biases.

Changepoint identification based on poorly researched and misleading metadata and application of arbitrary and inconsistent adjustments is neither credible nor scientific and should be abandoned.

An important link – find out more

Click here for full paper, photographs and tables of data.

The page you have just read is the basic cover story for the full paper. If you are stimulated to find out more, please link through to the full paper – a scientific Report in downloadable pdf format. This Report contains far more detail including photographs, diagrams, graphs and data and will make compelling reading for those truly interested in the issue.

Bill Johnston, 5 April 2020

Click here for full paper, photographs and tables of data.

[1] Dr. Bill Johnston’s scientific interests include agronomy, soil science, hydrology and climatology. With colleagues, he undertook daily weather observations from 1971 to 1979. 

[2] Australian Climate Observations Reference Network – Surface Air Temperature

Climate at Townsville

Dr. Bill Johnston

Dr. Bill Johnston’s scientific interests include agronomy, soil science, hydrology and climatology. With colleagues, he undertook daily weather observations from 1971 to 1979.

Abstract

Main points

  • Aerial photographs and Royal Australian Air Force plans and documents held by the National Library and National Archives of Australia show the Stevenson screen at Townsville airport moved at least three, possibly four times before 1969 while it was on the eastern side of the main runway; and probably twice between when it moved to a mound on the western side in January 1970 and to the current automatic weather station site in December 1994.
  • Of those site changes, a site move in 1953/54 and another in 1970 resulted in step-changes in maximum temperature data that were unrelated to the climate. A step-change in minima in 1968 appeared to be due to nearby disturbances associated with building an extension to the met-office. Importantly, except in the Bureau’s Garbutt instruments file, which is online at the National Archives (Barcode 12879364), none of the relocations or nearby changes are listed or described in site-summary metadata.   
  • By ignoring prior changes and smoothing the 1994 transition to the automatic weather station and small (60-litre) Stevenson screen, homogenisation created trends in maximum and minimum temperature that had nothing to do with the climate. 
  • Accounting simultaneously for site-related changes and covariates (rainfall for Tmax and Tmax for Tmin) leaves no residual trend, change or cycles attributable to the climate. Thus there is no evidence that the climate has warmed or changed.

Background

Like many of Australia’s ACORN-SAT weather stations[1], the site at Townsville airport was set-up in 1939 as an Aeradio office for monitoring air-traffic and to provide advice of inclement weather along the east coast route between Melbourne and Port Moresby.

Changes in facilities, instruments and functions caused the site to move irregularly; however, moves and changes prior to December 1994 were not detailed in ACORN-SAT or site-summary metadata. Despite repeated assurances in peer-reviewed publications written by Bureau climate scientists and others, that the history of ACORN-SAT sites had been exhaustively researched and appropriate adjustments had been made for the effect of site changes on data, it was not the case at Cairns and neither is it true for Townsville.

As there is no measurable change or warming in temperature data for Townsville Airport, claims of catastrophic consequences for the Great Barrier Reef are unfounded in the temperature data and, as a consequence, are grossly overstated.

An important link – find out more

The page you have just read is the basic cover story for the full paper. If you are stimulated to find out more, please link through to the full paper – a scientific Report in downloadable pdf format. This Report contains far more detail including photographs, diagrams, graphs and data and will make compelling reading for those truly interested in the issue.

Click here to download the full paper including photographs and tables of data used.

Note: Line numbers are provided in the linked Report for the convenience of fact checkers and others wishing to provide comment. If these comments are of a highly technical nature, relating to precise Bomwatch protocols and statistical procedures, it is requested that you email Dr Bill Johnston directly at scientist@bomwatch.com.au referring to the line number relevant to your comment.   


[1] http://www.bom.gov.au/climate/change/acorn-sat/documents/ACORN-SAT-Station-Catalogue-2012-WEB.pdf

Climate at Cairns

Dr. Bill Johnston

Dr. Bill Johnston ‘s scientific interests include agronomy, soil science, hydrology and climatology. With colleagues, he undertook daily weather observations from 1971 to 1979.

Abstract

Main points

  • Like many historical datasets, conditions affecting temperature measured at the Cairns post office are largely unknown. Site changes in 1900 and 1924 occurred in parallel with observations and an objective statistical method and post hoc attribution of changepoints as detailed previously for Gladstone Radar is preferable to relying on incomplete and possibly misleading metadata.
  • Metadata incorrectly specifies the location of the original aerodrome site near the 1939 Aeradio office and ignored the move to the mounded-site near the centre of the airport in 1966 and also that the site moved in September 1983 out of the way of a new taxiway. During construction when neither site was operational, aerial photographs show a fourth site was established near the location of the current automatic weather station. Data from that site either in-filled the record or were used to adjust for the 1983 move. A highly significant step-change in 1986 plausibly marked when in-filling or adjustments ceased.
  • Rainfall reduced Tmax 0.033oC/100 mm and together with site changes accounted for 53.7% of Tmax variation. Step-changes at the post office in 1900, 1924 and 1929 and at the airport in 1986 caused 1.01oC of warming in the data and there is no residual trend or change attributable to the climate.

Background

Cairns is located in northern Queensland and is the main tourist-hub for visitors to Port Douglas, the wet-tropics hinterland and the northern Great Barrier Reef (GBR). It is often in the news that survival of the GBR is threatened by climate change warming and following a coordinated ‘save the reef’ campaign in April 2018 the Great Barrier Reef Foundation was gifted almost $0.5b by then Prime Minister Malcolm Turnbull. While WWF and related entities including AYCC, GetUp! and the Climate Council continuously bang the same drum, the question remains: to what extent is the climate of the GBR changing or warming?

The best way to find out is to grab some data, undertake research and find out what is going-on.

Merged in October 1942, one hundred and twenty years of post office and airport data showed no evidence that the climate at Cairns has changed or warmed. No marked increases have occurred in the frequency of maximum temperature extremes and nothing suggests temperature is likely to increase markedly in the future.

Being a whole-of-government enterprise, climate change and warming has been created by Bureau of Meteorology scientists who ignored site changes that happened and adjusted for some that didn’t to cause warming in homogenised data that doesn’t exist. ACORN-SAT metadata claimed the only move at the airport was in December 1992 when the “site moved 1.5 km northwest (to the other side of the runway)”; which isn’t true. Picked-up by the ABC, The Conversation, Guardian, the former Fairfax press; numerous web-sites and professors dependent on funding from the Australian Research Council; it has all rested on an extremely dubious, and superficial, level of statistical analysis. It must surely be deeply concerning to any competent statistical analyst that the Bureau of Meteorology BOM) has only the most rudimentary knowledge of site changes at Cairns – site changes that have created significant step changes in the data. Exhaustive research into historical Public Works records reveals significant site changes affecting the temperature record at Cairns.

It is of concern that so much money has fallen out of the sky to address a problem that cannot be confirmed by a rigorous analysis of the data.         

An important link – find out more

The page you have just read is the basic cover story for the full paper. If you are stimulated to find out more, please link through to the full paper – a scientific Report in downloadable pdf format. This Report contains far more detail including photographs, diagrams, graphs and data and will make compelling reading for those truly interested in the issue.

Click here to download the full paper including photographs and tables of data used.

Note: Line numbers are provided in the linked Report for the convenience of fact checkers and others wishing to provide comment. If these comments are of a highly technical nature, relating to precise Bomwatch protocols and statistical procedures, it is requested that you email Dr Bill Johnston directly at scientist@bomwatch.com.au referring to the line number relevant to your comment.   

[1] Dr. Bill Johnston’s scientific interests include agronomy, soil science, hydrology and climatology. With colleagues, he undertook daily weather observations between 1971 and 1979.

Methods: Gladstone Qld

Dr Bill Johnston [1]

Dr. Bill Johnston’s scientific interests include agronomy, soil science, hydrology and climatology. With colleagues, he undertook daily weather observations from 1971 to 1979.

Abstract

Main Points

  • The weather station at Gladstone Radar marks the approximate southern extremity of the Great Barrier Reef.
  • Temperature and rainfall data are used to case study an objective method of analysing trend and changes in temperature data.
  • The 3-stage approach combines covariance and step-change analysis to resolve site change and covariable effects simultaneously and is widely applicable across Australia’s climate-monitoring network.
  • Accounting for site and instrument changes leaves no residual trend or change in Gladstone’s climate.

Background

In Part 1 of this series, temperature and rainfall data for Gladstone Radar (Bureau of Meteorology (BoM) site 39326) are used to case-study a covariate approach to analysing temperature data that does not rely on comparisons with neighbouring sites whose data may be faulty.

Advantages of the method are:

  • The approach is based on physical principles and is transparent, objective and reproducible across sites.
  • Temperature data are not analysed as time-series in the first instance, which side steps the problem of confounding between serial site changes and the signal of interest.
  • Changes in data that are unrelated to the causal covariate are identified statistically and cross-referenced where possible to independent sources such as aerial photographs and archived plans and documents. Thus the process can’t be manipulated to achieve per-determined trends.
  • The effect of site-changes and other inhomogeneties are verified statistically in the covariate domain. Thus the approach is objective and reproducible.
  • Covariate-adjusted data are tested for trend and other systematic signals in the time-domain.

Further, statistical parameters such as significance of the overall fit (Preg), variation explained R2adj and significances of coefficients provide an independent overview of data quality.

An important link – find out more

The page you have just read is the basic cover story for the full paper. If you are stimulated to find out more, please link through to the full paper – a scientific Report in downloadable pdf format. This Report contains far more detail including photographs, diagrams, graphs and data and will make compelling reading for those truly interested in the issue.

click here to download the full case study including photographs and tables of data used.

Note: Line numbers are provided in the linked Report for the convenience of fact checkers and others wishing to provide comment. If these comments are of a highly technical nature, relating to precise Bomwatch protocols and statistical procedures, it is requested that you email Dr Bill Johnston directly at scientist@bomwatch.com.au referring to the line number relevant to your comment.   

[1] Dr. Bill Johnston’s scientific interests include agronomy, soil science, hydrology and climatology. With colleagues, he undertook daily weather observations from 1971 to 1979.